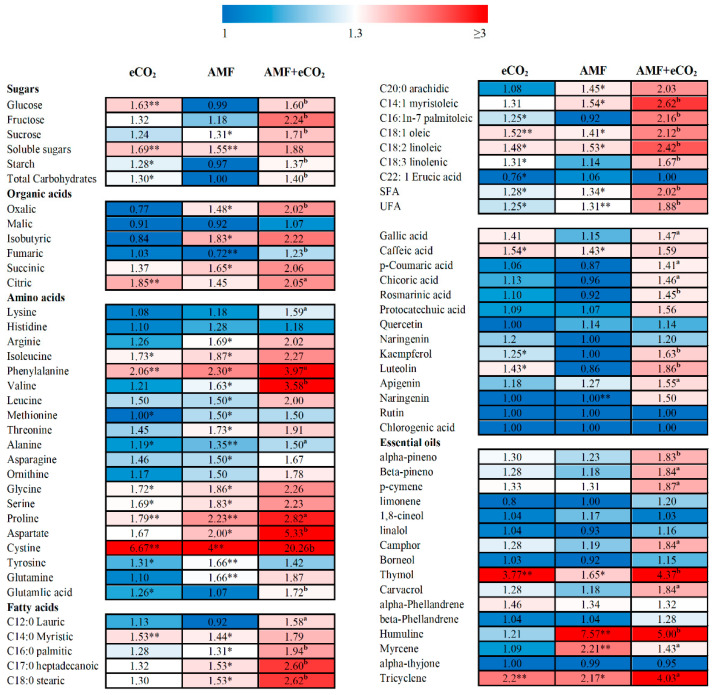
Figure 2.
Heatmap of fold change in the contents of primary and secondary metabolites of Thymus vulgare grown under the effect of eCO2 (620 ppm), AMF or their combination (AMF-eCO2). Asterisks indicate significant (* p < 0.05; ** p < 0.01) increased fold changes compared to control (untreated plants), as revealed by Student’s t-test. Lowercase letters indicate significant differences (a p < 0.05; b p < 0.01) between AMF alone and the combined AMF+eCO2 treatment.

