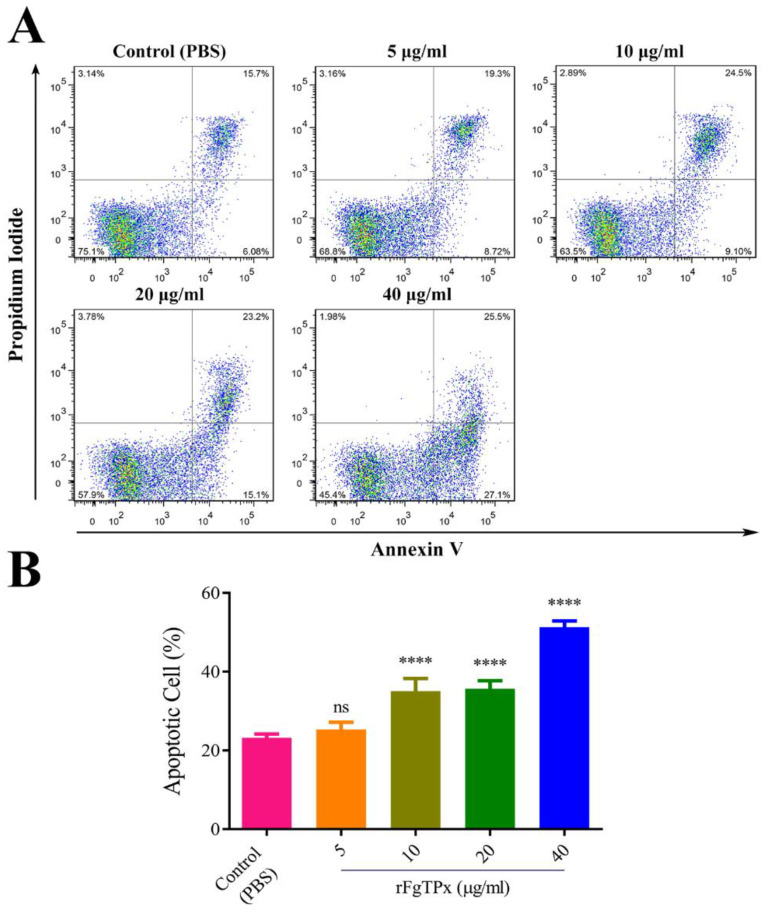
Figure 10.
The rFgTPx induced apoptosis in goat PBMCs. Apoptotic cells were determined by annexin V/PI staining and flow cytometry. (A) Flow cytometric analysis shows the death of goat PBMCs in response to exposure to increasing concentrations of rFgTPx. (B) The percentage of apoptotic cells (annexin V+/PI–) compared to total cell population. Graphs represent means ± standard deviations of data from three independent experiments. The asterisks indicate statistically significant differences between treated and untreated control PBMCs (**** p < 0.0001; ns: non-significant).

