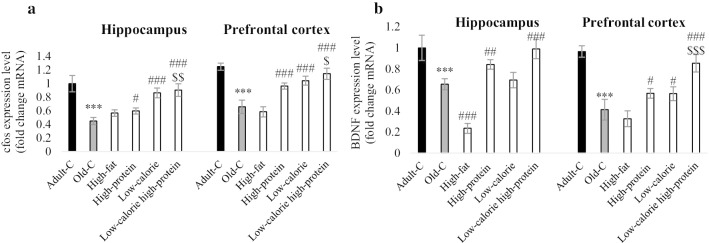
Fig. 3.
Gene expression of c-fos (a) and BDNF (b) in the hippocampus and prefrontal cortex (n = 4). Rats treated with high-fat, high-protein, low-calorie, low-calorie high-protein diets for 10 weeks. Control adult and old rats treated with rodent standard pellet. After behavioral tests, rats were euthanized and brains of three rats in each groups were collected for RT-PCR (n = 4 and technical repeat for each n is 3). Data were presented as Mean ± S.D. ***P < 0.001 ver. Adult-C, #P < 0.05, ##P < 0.01, ###P < 0.001 ver. Old-C. $P < 0.05, $$P < 0.01, $$$P < 0.001 ver. High-protein. Adult-C adult control rats, Old-C old control rats

