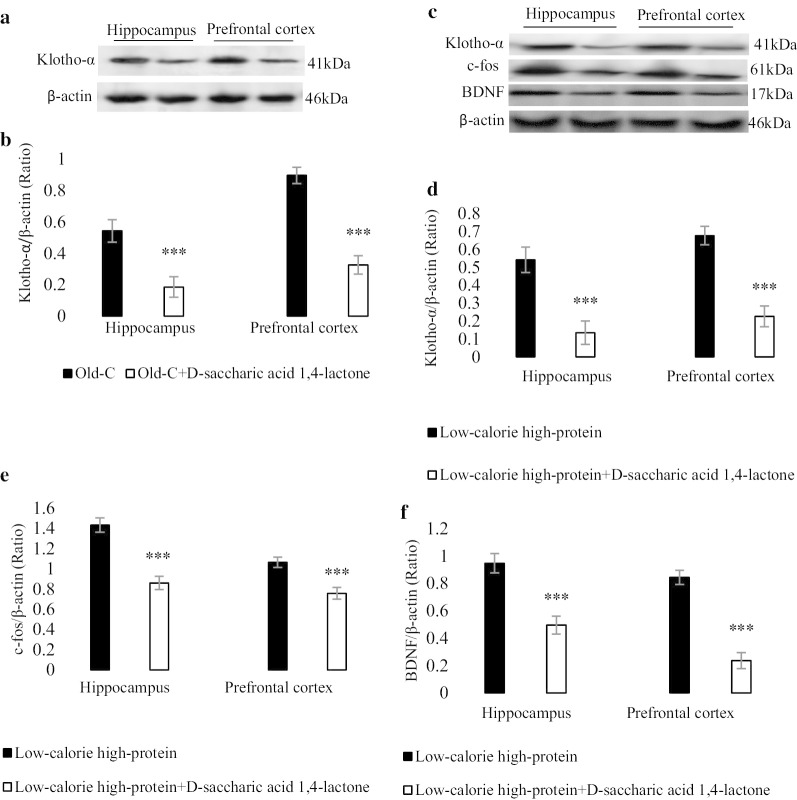
Fig. 4.
Molecular assessment of Klotho-α, c-fos and BDNF in the hippocampus and prefrontal cortex of experimental groups (n = 4). A represented blot showed Klotho-α in the old rats with standard diet for 10 weeks and old rats with Klotho-α inhibitor (d-saccharic acid 1,4-lactone, orally administrated 2 time/week for 10 weeks) (a) and the density of Klotho-α band (b) was measured. A represented blot showed Klotho-α, c-fos and BDNF in the low-calorie high-protein group (treated for 10 weeks) with and without Klotho-α inhibitor (c) and the density of Klotho-α (d), c-fos (e) and BDNF (f) bands were measured in the hippocampus and prefrontal cortex. Data were presented as Mean ± S.D. ***P < 0.001 ver. low-calorie high-protein group. Adult-C adult control rats, Old-C old control rats

