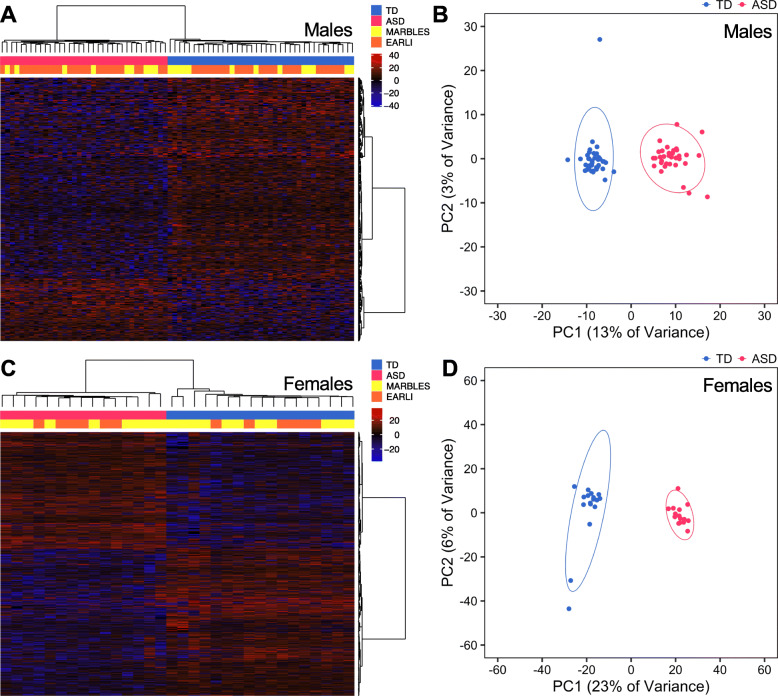
Fig. 1.
DMRs identified in males and females distinguish ASD from TD subjects in the discovery set. a Heatmap or b principal component analysis (PCA) plot using percent methylation for each sample in autism spectrum disorder (ASD) versus typically developing (TD) differentially methylated regions (DMRs) identified in cord blood from male discovery subjects (150 hypermethylated DMRs, 485 hypomethylated DMRs; TD n = 39, ASD n = 35). c Heatmap or d PCA plot using percent methylation for each sample at ASD DMRs identified in cord blood from female discovery subjects (863 hypermethylated DMRs, 1089 hypomethylated DMRs; TD n = 17, ASD n = 15). For heatmaps, subjects are colored by diagnostic group and study, and methylation is relative to the mean for each DMR. For PCA plots, ellipses indicate 95% confidence limits. EARLI, Early Autism Risk Longitudinal Investigation; MARBLES, Markers of Autism Risk in Babies - Learning Early Signs

