Figure 3.

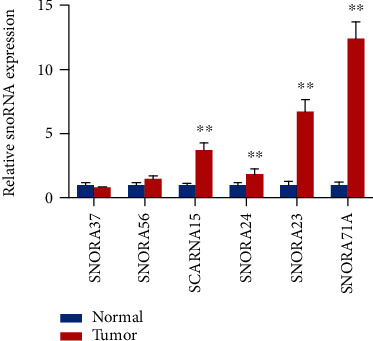
Validation of six candidate snoRNA expression. The relative expression levels of the six candidate snoRNAs were measured by qPCR. The values are expressed as the mean ± SD (n = 3). ∗P < 0.05, ∗∗P < 0.01.

Validation of six candidate snoRNA expression. The relative expression levels of the six candidate snoRNAs were measured by qPCR. The values are expressed as the mean ± SD (n = 3). ∗P < 0.05, ∗∗P < 0.01.