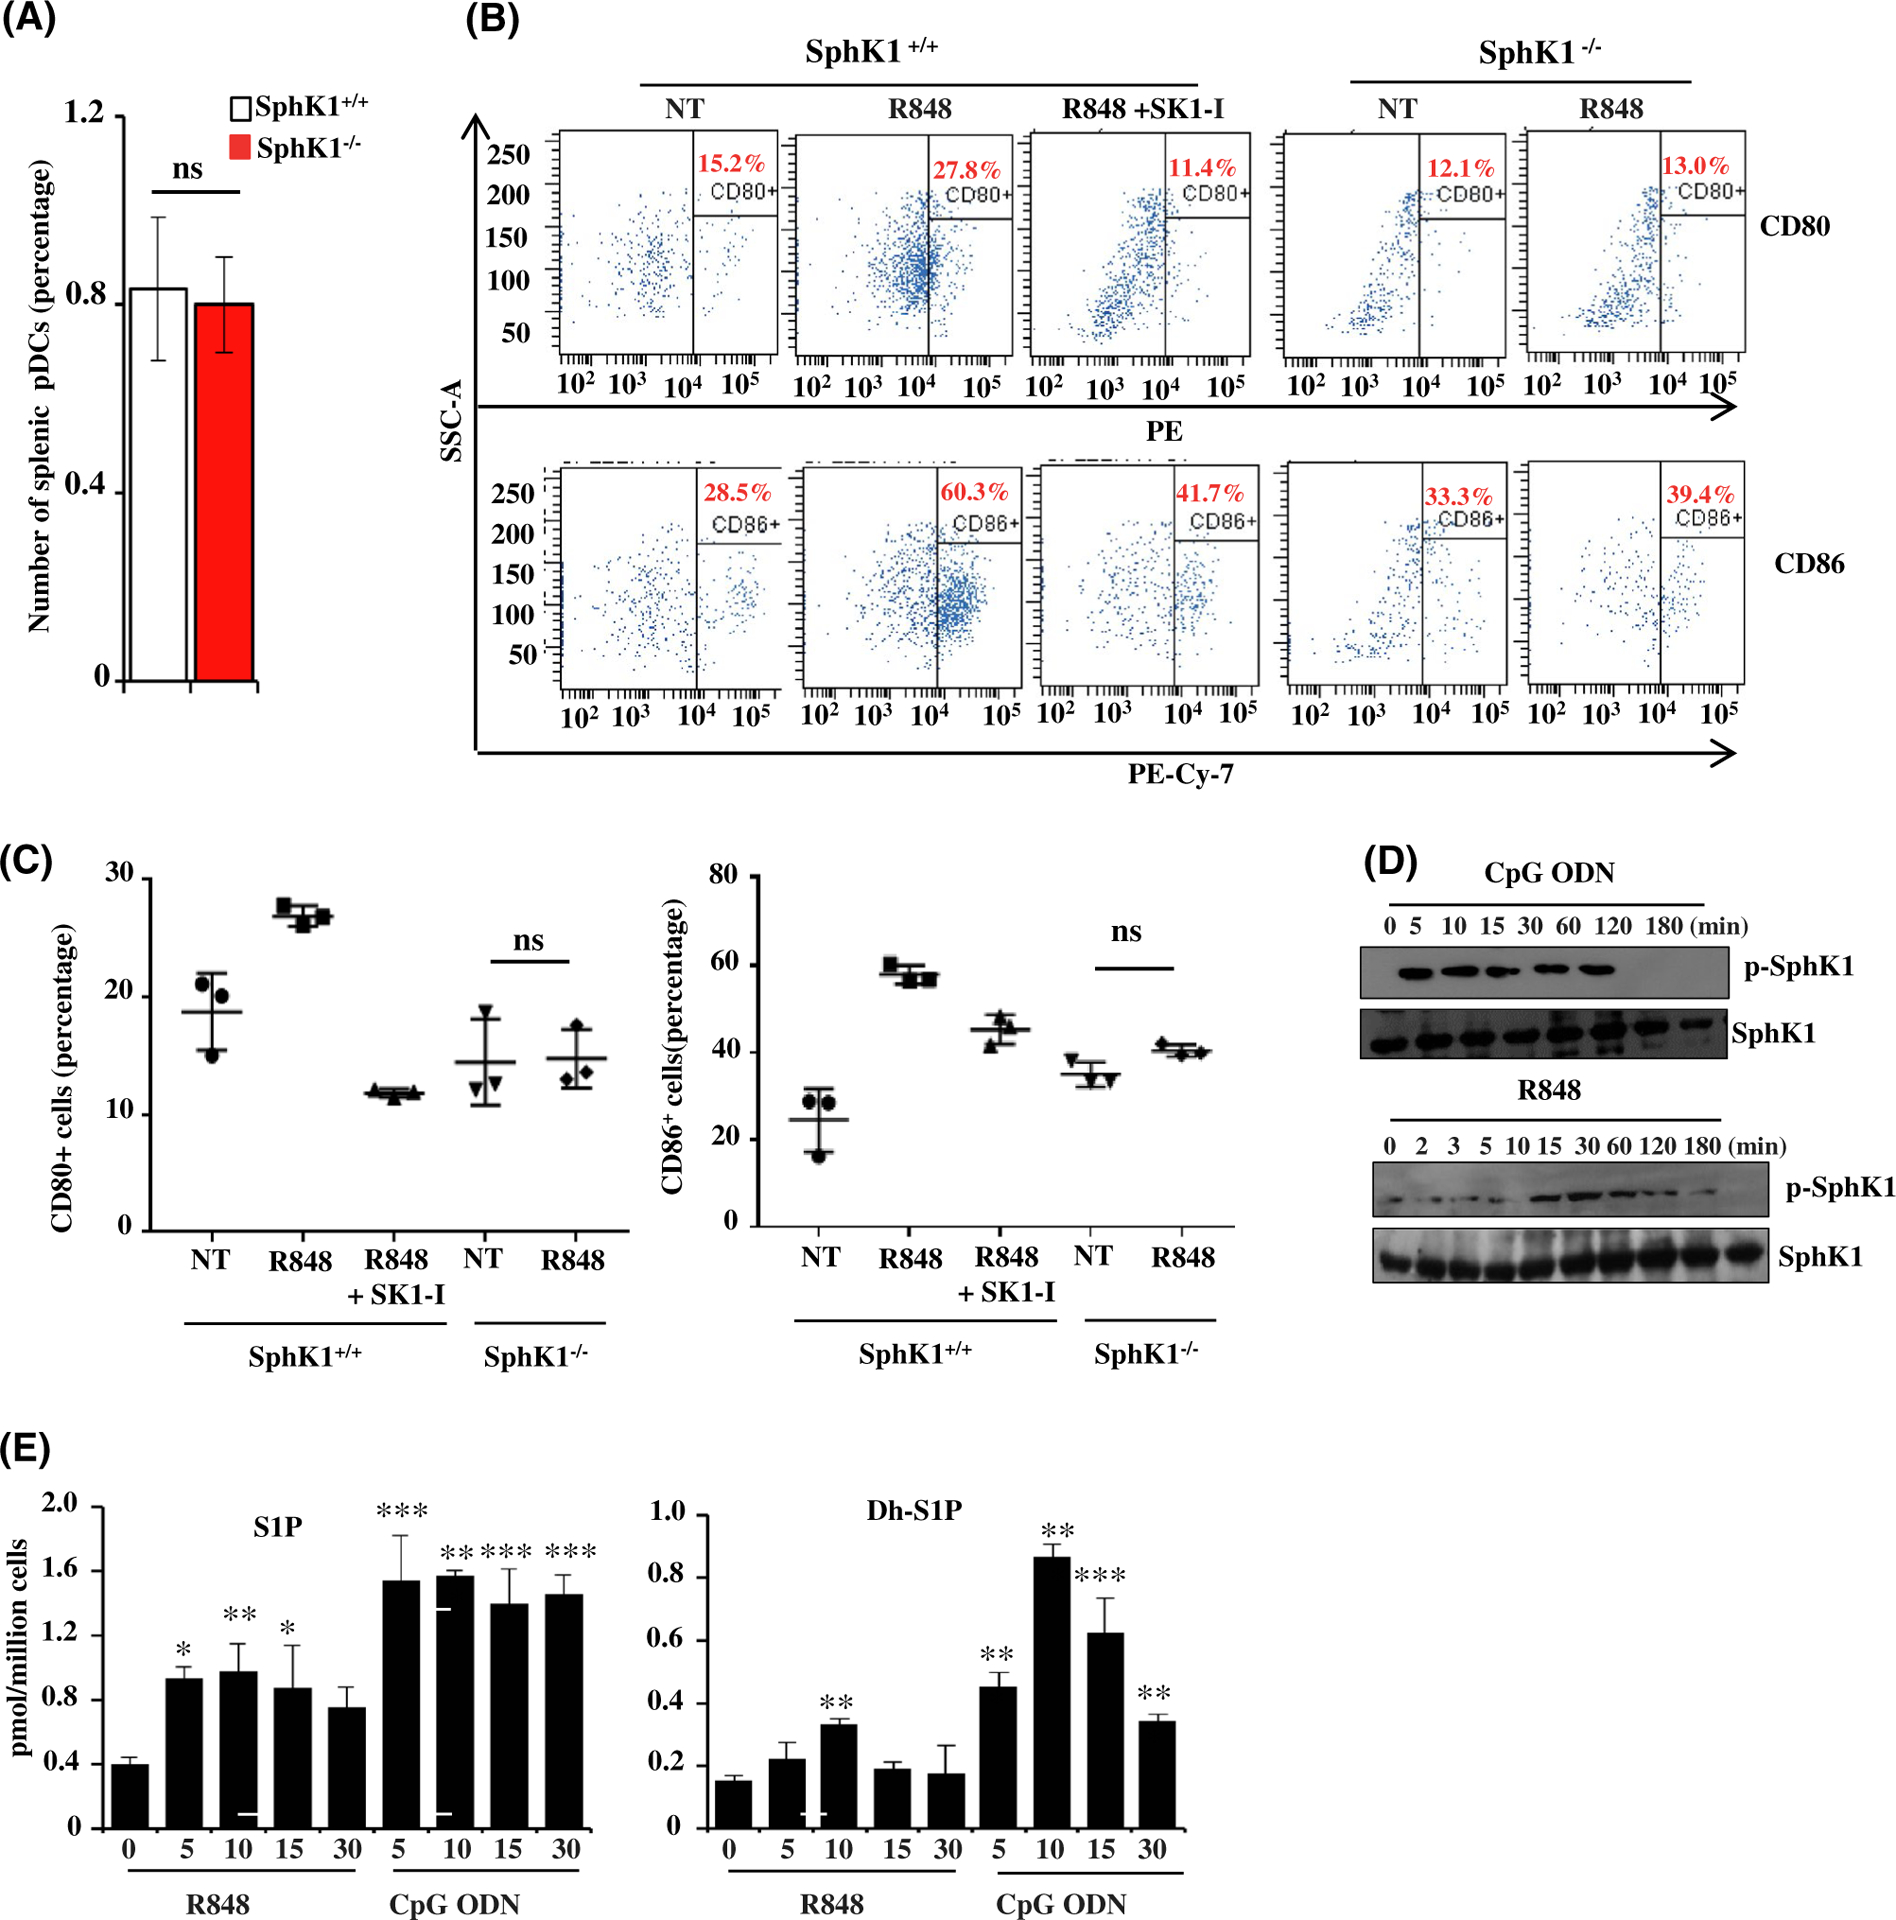
FIGURE 2.

Involvement of SphK1 in pDC activation. A, Numbers of splenic pDCs isolated from wild-type and SphK1−/− mice determined by flow cytometry. Data are mean ± SD of four independent experiments. B, Activation status (CD80-PE/CD86-PECy7) of splenic pDCs from SphK1+/+ and SphK1−/− mice determined by flow cytometry after TLR7 stimulation. Where indicated, cells were pretreated for 30 min with SK1-I prior to R848 treatment. C, Quantification of flow cytometry data in Figure 2B. D, CAL-1 cells treated with CpG-ODN (1 μM) or R848 (10 μg/mL) for the indicated times. Proteins separated by SDS-PAGE and immunoblotted with the indicated antibodies. Blots are representative of three independent experiments. E, CAL-1 cells treated with R848 (10 μg/mL) or CpG-ODN (1 μM) for the indicated times (in min) and the level of S1P and dihydro-S1P (DH-S1P) in the cell culture supernatant determined by LC-ESI-MS/MS. Statistical significance was determined by Student’s t test (A) or ANOVA followed by post hoc Tukey test (C, E). n.s—P > .05, *P < .05, **P < .005, ***P < .001
