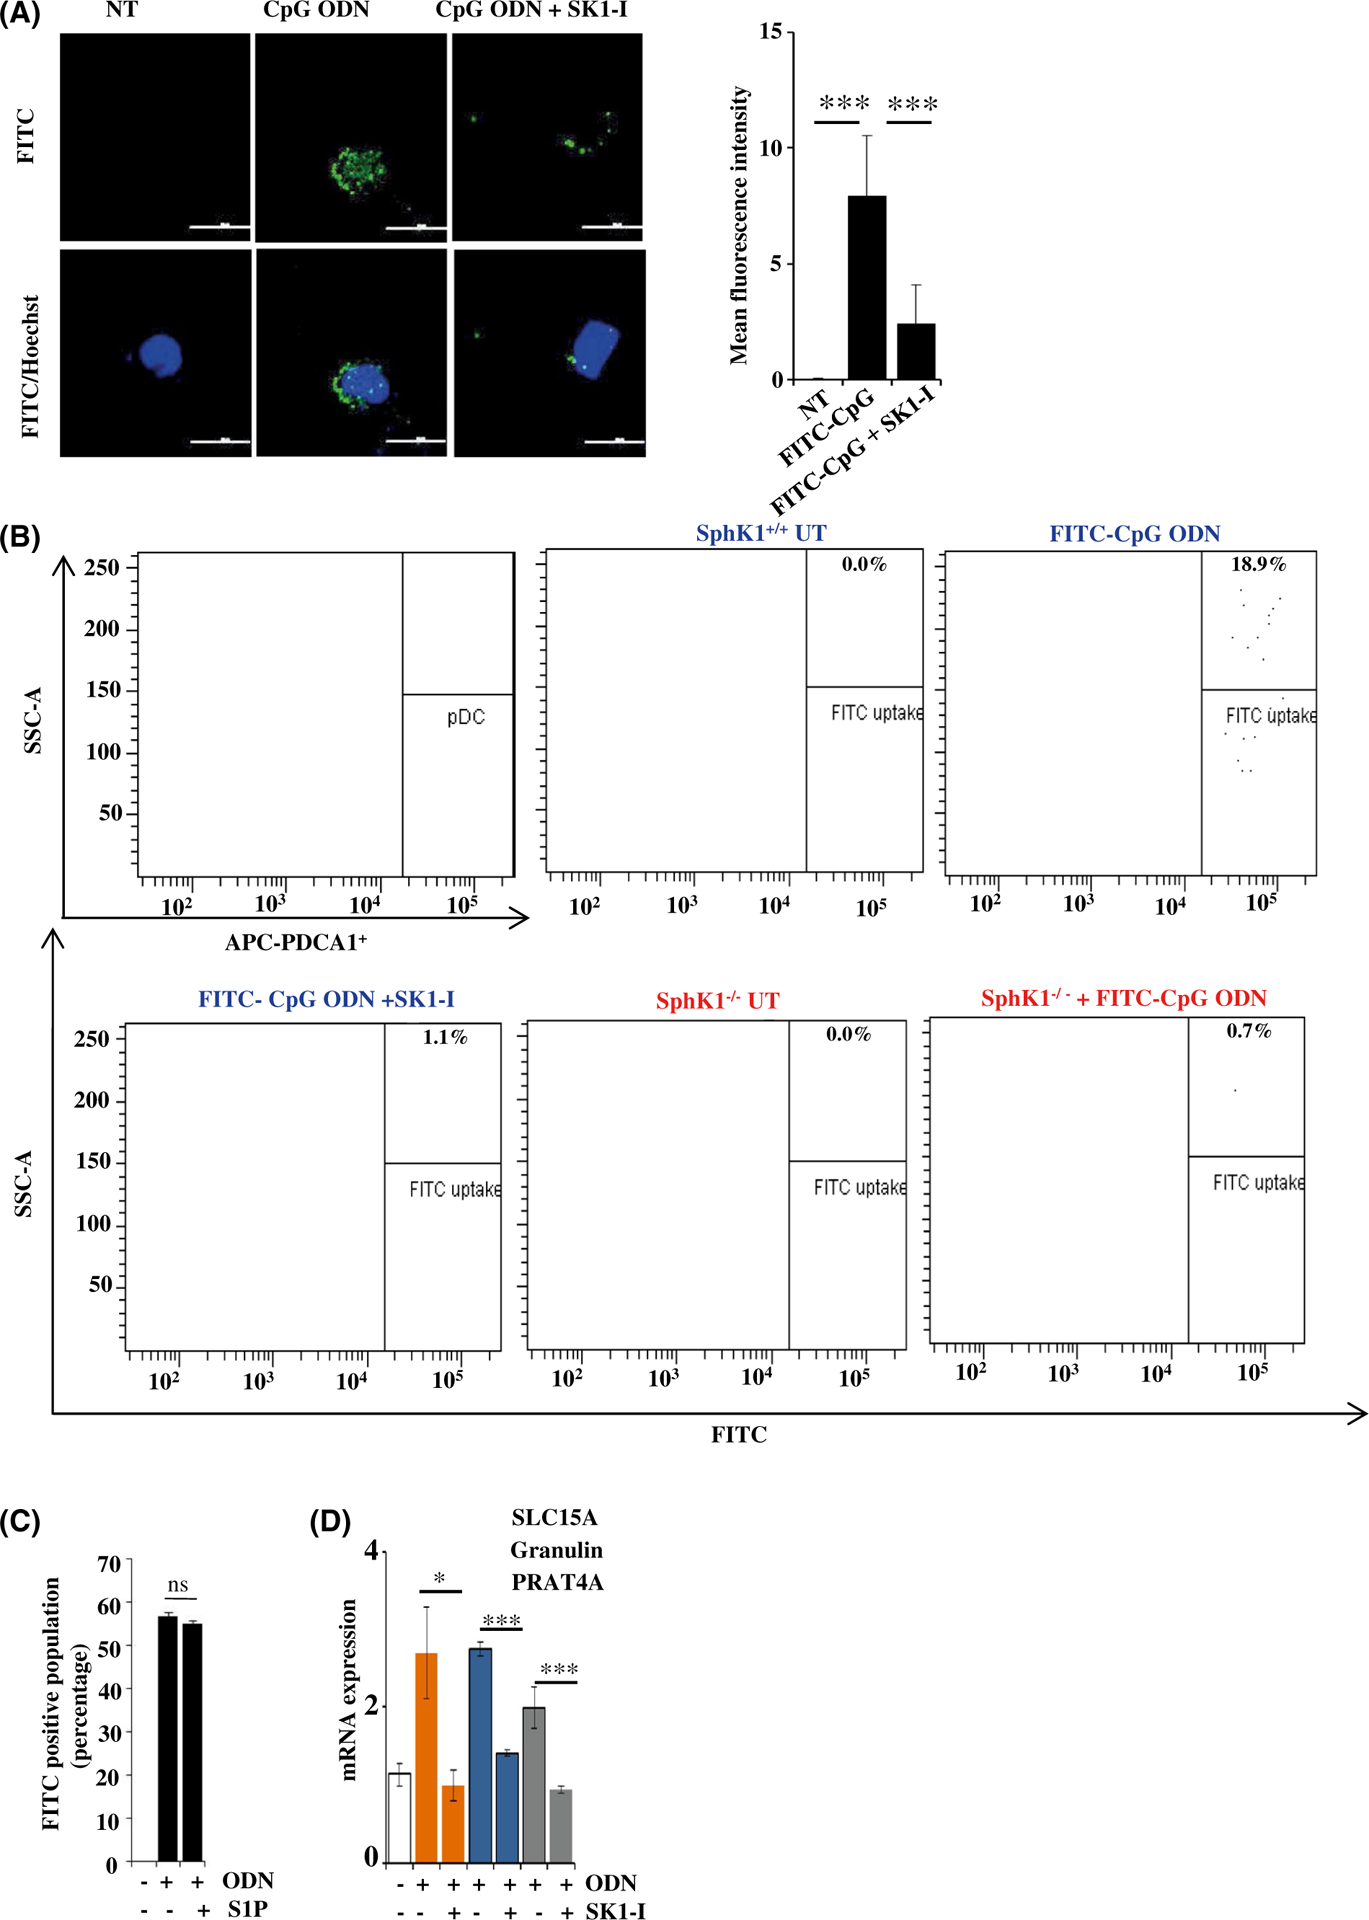
FIGURE 5.

SphK1 regulates uptake of CpG-ODN by dendritic cells. A, CAL-1 cells pretreated with SK1-I (10 μM) for 30 min followed by stimulation without or with FITC-CpG-ODN (50 nM) for 20 min. CpG uptake was analyzed by immunofluorescence microscopy. Nuclei counter stained with Hoechst 33342.Images representative of five independent experiments. Scale bar: 20 μm. Graphical representation of FITC-CpG ODN uptake by Image J software. B, Splenocytes isolated from SphK1+/+ and SphK1−/−mice (n = 4/group) and gated for splenic pDCs by staining with APC-PDCA1. Cells were treated as in Figure 5A. CpG uptake by splenic pDCs was analyzed by flow cytometry as indicated by FITC fluorescence. C, Uptake of FITC-CpG-ODN analyzed by flow cytometry and data expressed as percentage of FITC-positive cells. Data are mean ± SD from three independent experiments. D, CAL-1 cells were treated with CpG-ODN as in Figure 1A. mRNA levels of SLC15A, Granulin, PRAT4A determined by qPCR and normalized to β-actin. Data are mean ± SD of five independent experiments. Statistical significance was determined by Student’s t test to compare between two experimental groups (D) and ANOVA (A,C), post hoc Tukey test, *P < .05, **P < .005, ***P < .001
