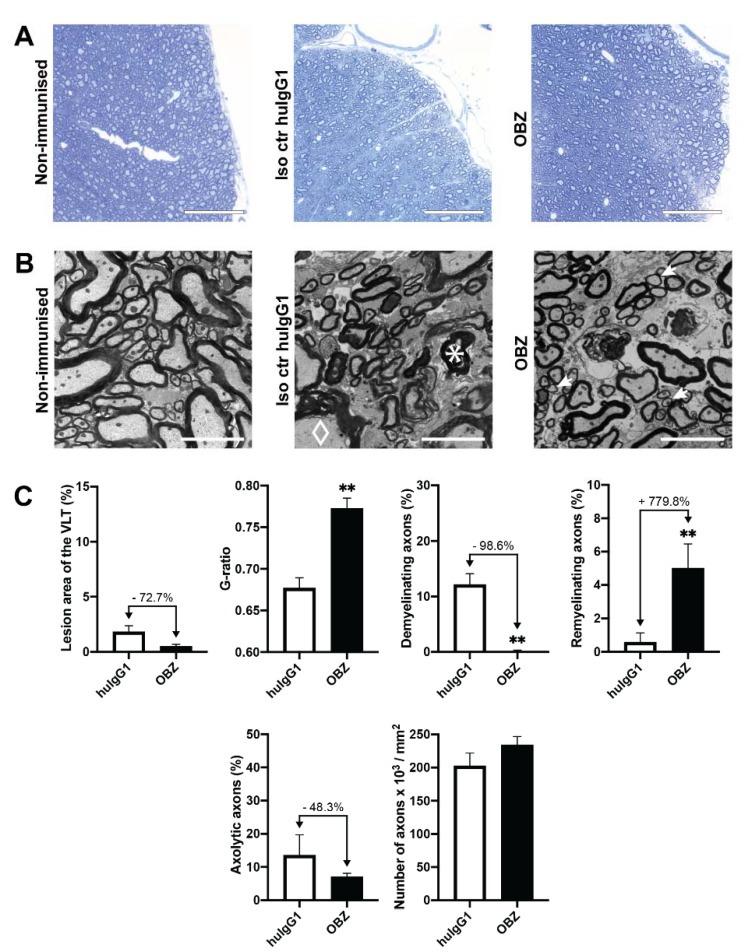
Figure 4.
Spinal cord histopathology in CD20dbtg mice treated from day 50 after the EAE peak with OBZ or huIgG1, respectively. (A) Representative light microscopic images of the spinal cord. The scale bar represents 75 µm. (B) Representative electron micrographs of the spinal cord. The scale bar represents 5 µm. An exemplary demyelinating axon is marked with a diamond, three remyelinating axons with arrows and an axolytic axon with a star, respectively. Images of untreated non-immunised mice have been added in both (A) and (B) for reference. (C) Quantification of the treatment effect on the lesion area, g-ratio, demyelination, remyelination, axolysis and number of axons. Values are displayed as mean values ± standard error of the mean (SEM). *: p < 0.05; **: p < 0.01. Statistical significance was determined using the Mann–Whitney U test.

