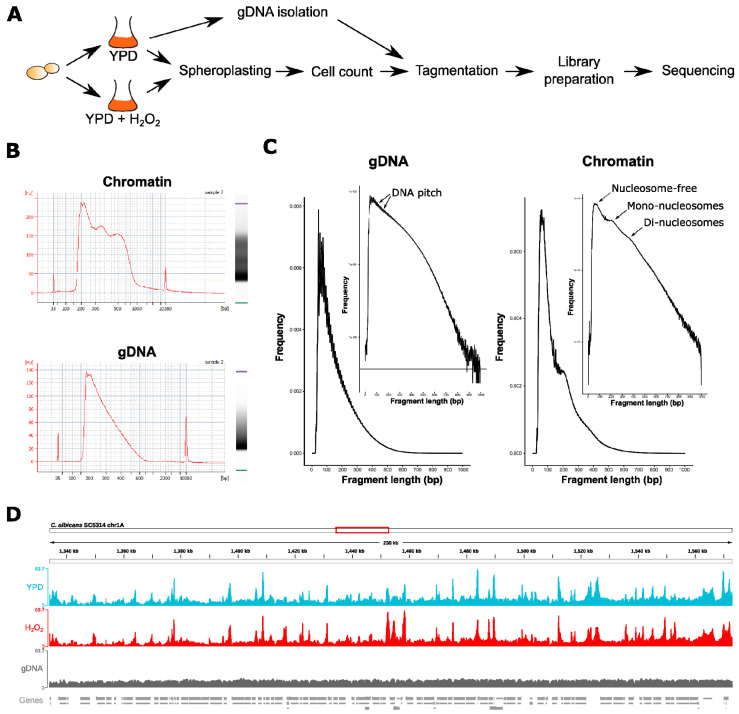
Figure 1.
Quality control of assay for transposase-accessible chromatin using sequencing (ATAC-seq) libraries from Candida albicans treated or non-treated with H2O2. (A) Experimental set-up for ATAC-seq profiling of 5 × 10⁶ C. albicans (see Materials and Methods for details). (B) Bioanalyzer electrophoretic profiles and gel image from ATAC-seq libraries prepared from fungal chromatin (isolated nuclei) or naked gDNA. The x-axis from the electropherogram depicts the fragment size distribution (bp) of tagmented samples and the y-axis represents the abundance. A distinct nucleosomal pattern (mono-, di-, and tri-nucleosomes) is visible in chromatin samples, but not in tagmented gDNA samples. (C) Fragment length distribution of ATAC-seq reads from gDNA and nuclei prepared from YPD (1% yeast extract, 2% peptone, 2% glucose)-grown cells. The fragment length in bp (x-axis) from one representative biological replicate from each group is plotted against its frequency (y-axis). The graph insert shows the log-transformed histogram. Signals originating from the DNA helical pitch [31] are emphasized by arrows on the gDNA plot. Arrows on the chromatin plot indicate nucleosome-free ATAC-seq read fragments and nucleosome occupied read fragments. (D) Integrative Genomics Viewer (IGV) browser snap-shot from a 238 kb region of the C. albicans chromosome 1A of ATAC-seq reads from aligned BAM files. The biological replicates from each sample group were pooled. Genes are depicted as gray boxes below the sequencing read coverage tracks.

