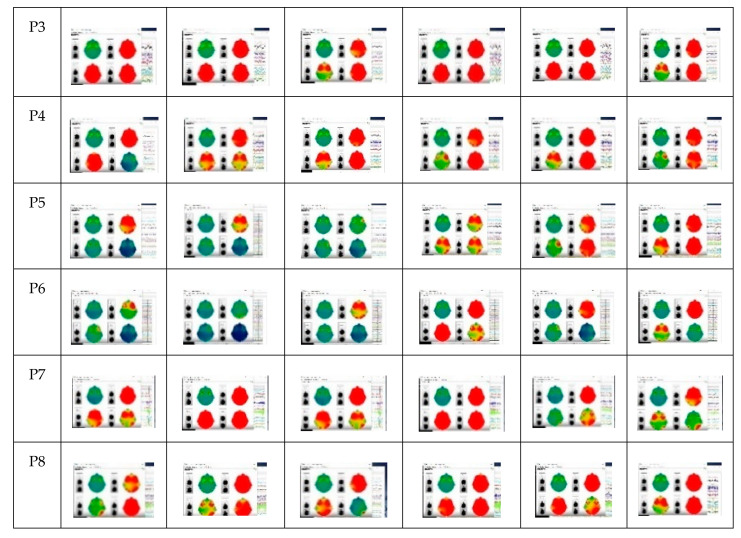
Figure 6.
Brain activity sequences of eight participants (one line for each participant) in the “goal” throwing condition. Each frame shows the delta (upper-left), theta (upper-right), alpha (bottom-left), and beta (bottom-right) oscillations of each moment. These frames, taken every two seconds, correspond to the central 12” of the task.


