Figure 7.

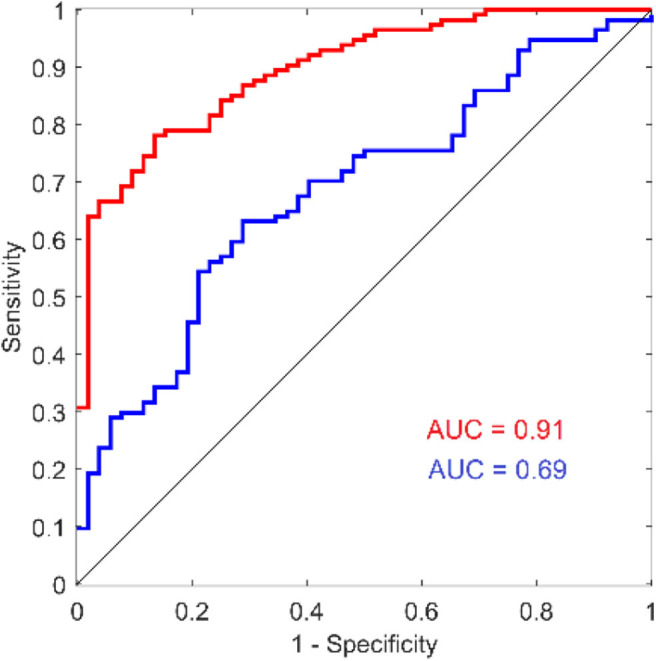
ROC curves for reaction time and reaction time variability from a recent study comparing concussed to non-concussed individuals. Reproduced with modification and with permission from (Favorov et al., 2019).

ROC curves for reaction time and reaction time variability from a recent study comparing concussed to non-concussed individuals. Reproduced with modification and with permission from (Favorov et al., 2019).