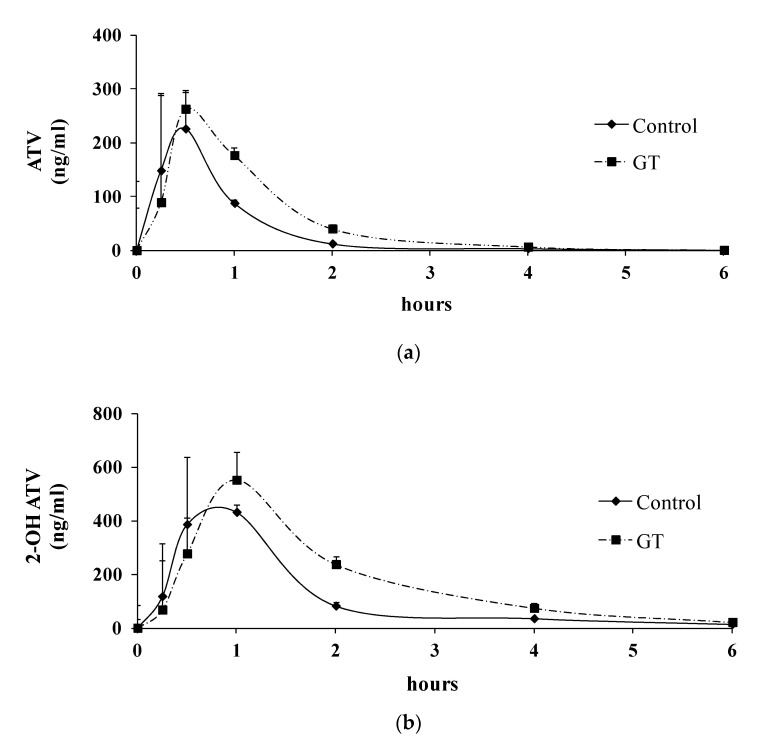
Figure 2.
Plasma concentration–time profiles of atorvastatin (ATV) (a) and 2-OH ATV (b) after 3 weeks of GT treatment in rats. The atorvastatin was administered orally (10 mg/kg body weight) to rats after the consumption of GT for 3 weeks. Values at each time point are expressed as the mean ± SD (n = 6). ●: control group; ■: GT group.

