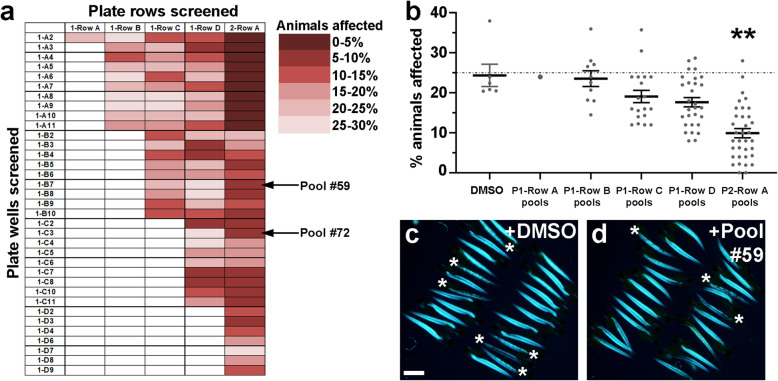
Fig. 4.
Pilot screen identifies the ability of plate 2 row A chemical pools to lower the frequency of affected dmd animals. (a) Heat map representation of the average percentage of affected animals observed from each of the 93 pools tested. Individual chemical wells tested were from plate 1 (left column, plate number and well number shown). Library rows tested are rows A-D from plate 1 and row A from plate 2. See Table 1 for the chemicals in each well and row. Arrows point to pilot screen pool #59 (pool 135 in Fig. 1b), shown in (d), and pilot screen pool #72 (pool 173 in Fig. 1b), analyzed in Fig. 5 below. (b) Graph of combined average percentages of affected animals from all tested pools that included each plate row. Control treatments are 1% DMSO. The dashed line represents the average of the control DMSO treatments (25%). Each dot represents a tested drug pool’s average of affected animals. Error bars represent standard error. Significance was determined using a one-way ANOVA test comparing each chemical pool group to the DMSO control group with Dunnett’s correction for multiple comparisons. **p = 0.0021 compared to DMSO control. (c, d) Example of birefringence images of 4 dpf larvae from a replicate of (c) DMSO control and (d) pool #59 (plate 2 row A + UNC0638) treatments. DMSO control animals are siblings of pool #59 animals. Asterisks mark affected animals. Scale bar = 1 mm

