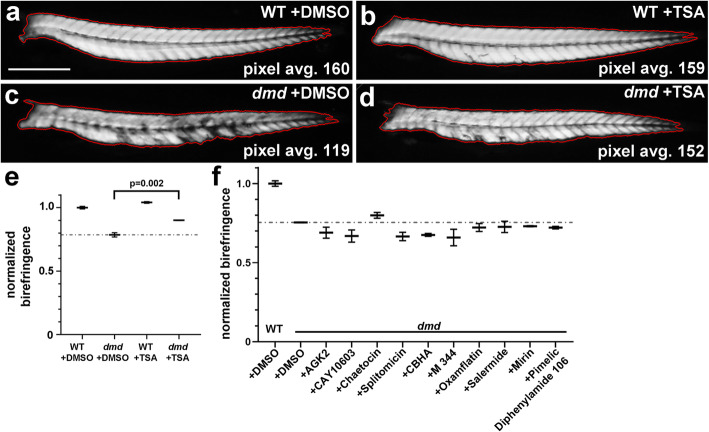
Fig. 5.
Individual compounds from plate 2 row A do not significantly improve zebrafish dmd mutant muscle birefringence. a-d Four dpf zebrafish trunk muscle, with trunk skeletal muscle birefringence outlined in red. Lateral views, anterior to the left. Average pixel brightness values are shown for (a) wild-type (WT) + DMSO, (b) WT + TSA, (c) dmd + DMSO, and (d) dmd + TSA. Scale bar = 500 μm. e Graph of normalized birefringence pixel intensities for 200 nM TSA treatments vs DMSO controls. n = 3 biological replicates for each treatment. Plot shows the average normalized pixel intensity for the 3 replicates for each treatment (4-9 genotyped animals per replicate). The dashed line represents the average normalized pixel intensity for all of the DMSO-treated dmd animals (n = 17). Error bars represent standard error. p value determined by Student’s t test. (f) Graph of normalized birefringence pixel intensities for treatments of zebrafish dmd mutants with the 10 individual chemicals from plate 2 row A. Control treatment is 1% DMSO. All chemicals were tested at 1 μM. For each treatment condition, n = 3 replicates, with 2-9 dmd embryos in each replicate. Plot shows the normalized birefringence pixel intensity for the 3 replicates for each treatment. The dashed line represents the average normalized pixel intensity for all of the DMSO-treated dmd animals (n = 15). Error bars represent standard error. Significance was determined using a one-way ANOVA test comparing each treatment group to the dmd DMSO control group with Dunnett’s correction for multiple comparisons. p > 0.2 for all individual chemicals compared to dmd DMSO control

