
Figure 1.
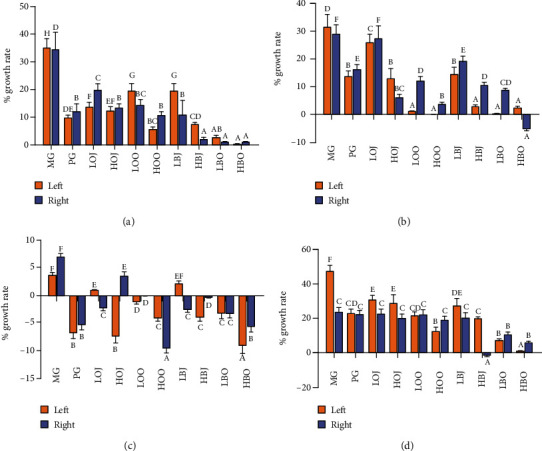
Effect of different treatments on the growth rate of sebaceous gland spots: (a) the growth rate of sebaceous gland spots in the first week, (b) the growth rate of sebaceous gland spots in the second week, (c) the growth rate of sebaceous gland spots in the third week, and (d) the growth rate of sebaceous gland spots in the fourth week. Values are expressed as the mean ± SD (n = 8). Data with different letters indicate significant differences (P < 0.05).