Figure 2.

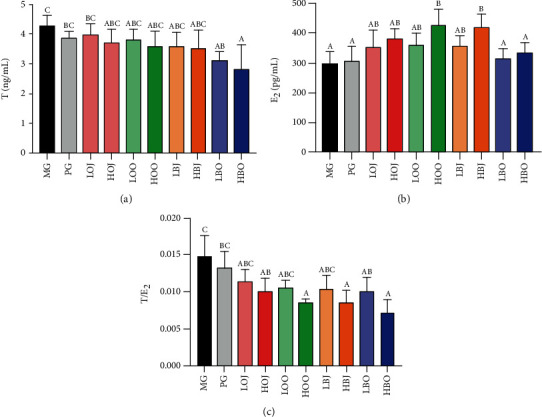
Effect of different treatments on serum sex hormone levels: (a) serum T level, (b) serum E2 level, and (c) the ratio of T/E2. Values are expressed as the mean ± SD (n = 8). Significance was defined as P < 0.05.

Effect of different treatments on serum sex hormone levels: (a) serum T level, (b) serum E2 level, and (c) the ratio of T/E2. Values are expressed as the mean ± SD (n = 8). Significance was defined as P < 0.05.