Figure 3.

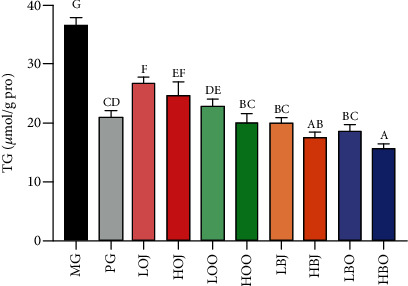
Effect of different treatments on the level of TG. Values are expressed as the mean ± SD (n = 8). Data with different letters indicate significant differences (P < 0.05).

Effect of different treatments on the level of TG. Values are expressed as the mean ± SD (n = 8). Data with different letters indicate significant differences (P < 0.05).