
Figure 2.
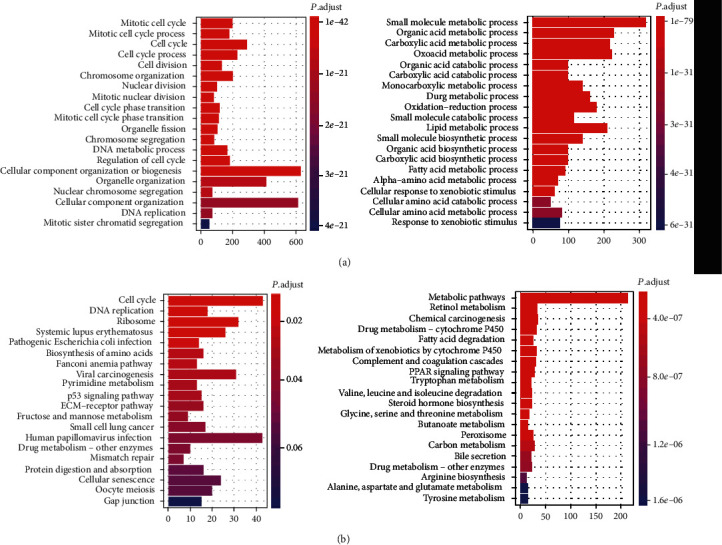
The GO biological processes and KEGG pathways enriched by the differentially expressed genes. (a) The GO biological processes enriched by the DEGs. The bars on the left and right represent the enriched GO terms enriched by the upregulated and downregulated genes, respectively. (b) The enriched KEGG pathways by the DEGs. The up- and downregulated genes were enriched in the pathways represented by the bars on the left and right, respectively.