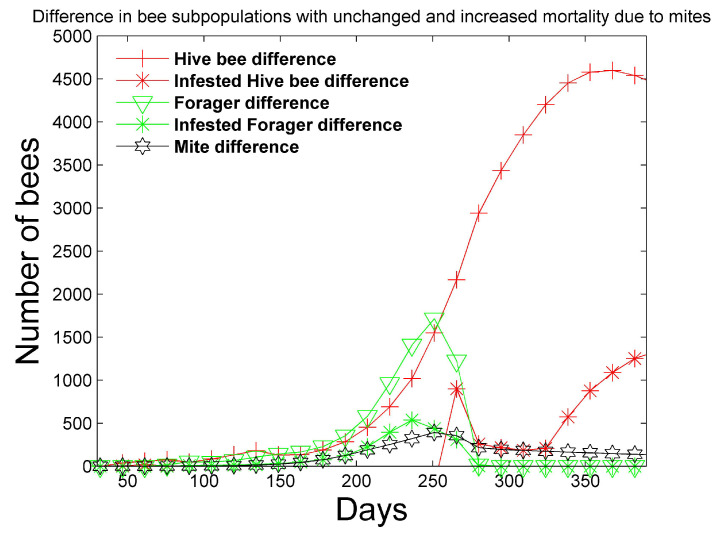
Figure 7.
Two-year simulation of a honey bee colony with mites using the simulation parameters in Table 4 and Table 5. Mites increase the mortality rates in Table 3 of infested pupae, hive, drone, and foragers by four times. Only the first year is shown since the colony does not survive past the first year. In this figure, the difference between the number of bee subpopulations (total hive bees, infested hive bees, total foraging bees, and infested foraging bees) with unchanged mortality (Figure 1 and Figure 2) and the bee subpopulations with increased mortality is plotted.

