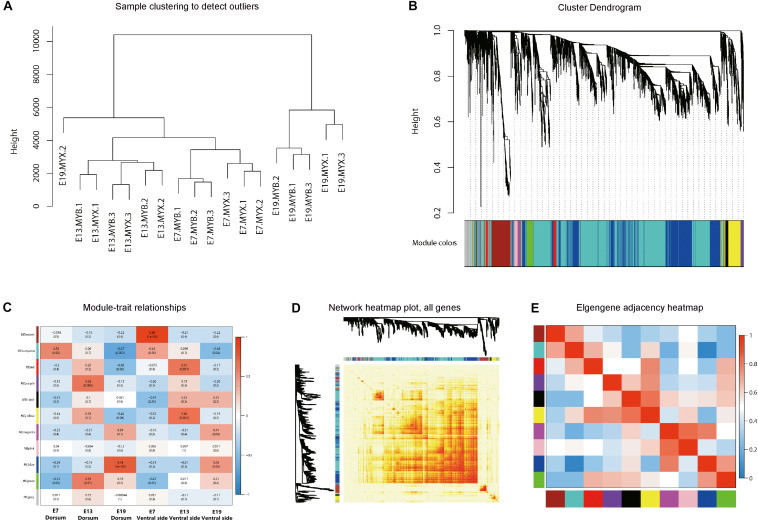
FIGURE 4.
Weighted gene co-expression network analysis (WGCNA). (A) Sample clustering diagram. E + number represents different embryonic development stages. MYB and MYX represents dorsal and ventral skin samples of LBM embryo, respectively. (B) Hierarchical clustering tree. Different colors on the abscissa represent different clustering modules. (C) Correlation between modules and traits. The abscissa represents different trait groups, and the ordinate represents different modules. (D) Visualized network heat map. (E) Correlation diagrams between modules. The redder the color of the area where different modules intersect is, the stronger the correlation.

