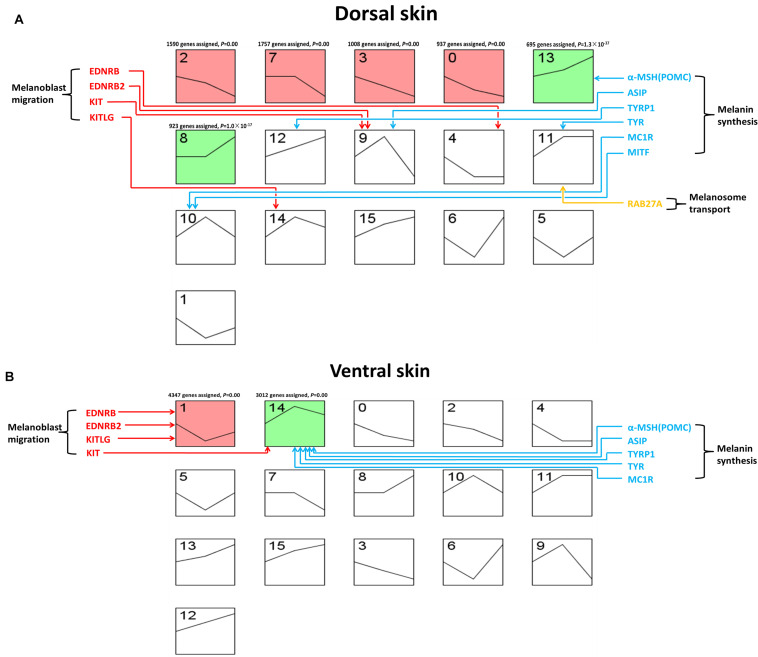
FIGURE 5.
Gene expression pattern of LBM embryonic development stage. The horizontal axis of each block represents the developmental stage. The three developmental stages from left to right are E7, E13, and E19. The vertical axis represents the gene expression level. Colored boxes indicate that the P-value is less than 0.05. Boxes with the same color indicate that their expression patterns are similar. (A) Clustering of expression patterns of genes in the dorsal skin development of LBM embryos. (B) Clustering of expression patterns of genes in the ventral skin development of LBM embryos.

