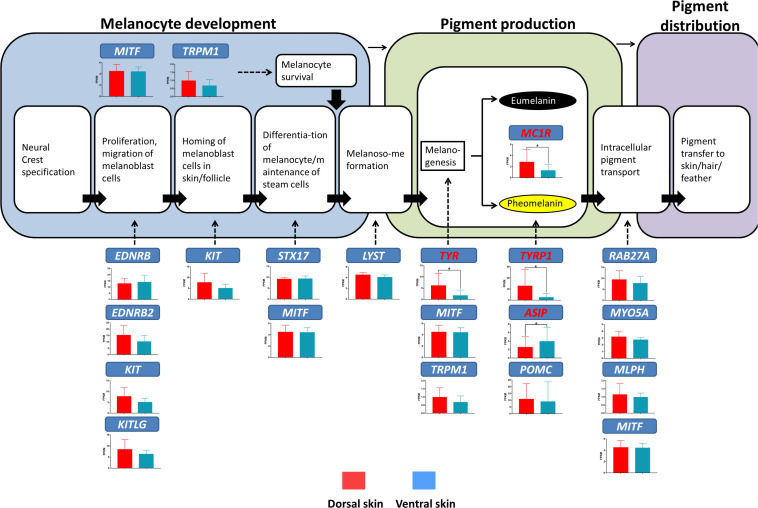
FIGURE 7.
Gene expression levels at different stages of melanin production in LBM ducks (Cieslak et al., 2011). The bar charts show the mRNA expression of genes responsible for different melanin deposition processes in the dorsal and ventral skin. The red bars represent the mRNA expression level in dorsal skin; the blue ones represent that in ventral skin. Red marked genes are those that show significantly different mRNA expression level between the dorsum and ventral side.

