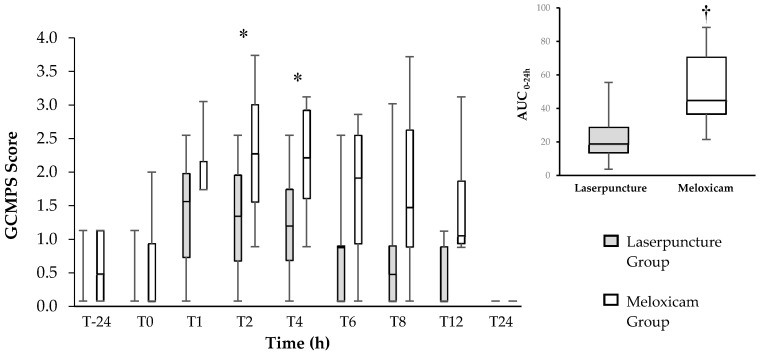
Figure 1.
Left—Box plot of the Glasgow Composite Measure Pain Scale (GCMPS) scores over time (center horizontal lines express the medians; box limits indicate the 25th and 75th percentiles, whiskers extend 1.5 times the interquartile range from the 25th and 75th percentiles) for 16 bitches treated preoperatively with laserpuncture (n = 8) or meloxicam (n = 8) and submitted to ovariohysterectomy. * Indicates the differences between groups at T2 (p = 0.042) and T4 (p = 0.022) according to Mann–Whitney test. Right—Box plot of the area under the curve (AUC) of the GCMPS scores (center horizontal lines express the medians; box limits indicate the 25th and 75th percentiles, whiskers extend 10th and 90th percentiles) between 0–24 h. † Indicates difference between groups (p = 0.007).

