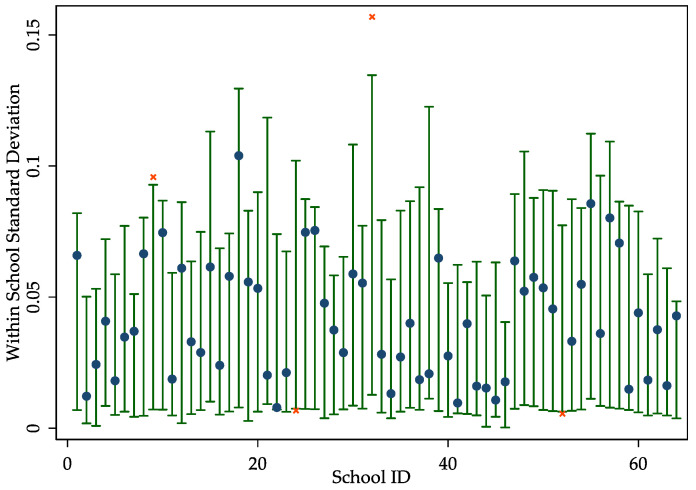
Figure 1.
Monte Carlo Simulations of left behind children (LBCs) share. Notes: The figures present the Monte Carlo simulations for the within-school standard deviation in the share of LBCs. Vertical bars represent simulated 95% confidence intervals for within-school standard deviations in the share of LBCs. Scatter points represent actual within-school standard deviations for each school. Filled circles indicate that the actual standard deviation is within the simulated 95% confidence interval, whereas x’s indicate schools with standard deviations outside the simulated confidence interval.

