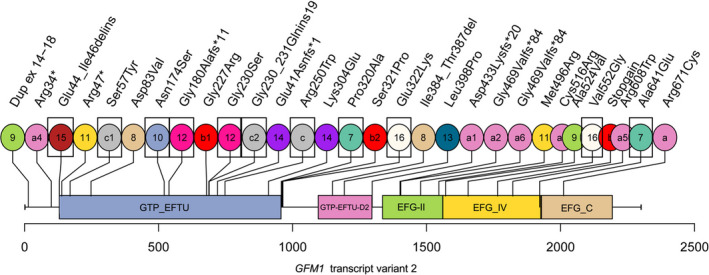
FIGURE 6.

Map of previously reported and novel variant we obtained along the GFM1 protein (transcript variant 2). Circles filled with the same color and the same number represent a set of compound heterozygous mutation. The mutation frequencies of a (c.2011C > T), b (c.1765‐2_1765‐1del), and c (c.748C > T) are higher. They form different complex heterozygous mutations with other mutations (a1‐6, b1, b2, c1, c2). b1(c.679G > A) is the novel mutation we found. Patients with mutations in rectangular boxes had liver involvement
