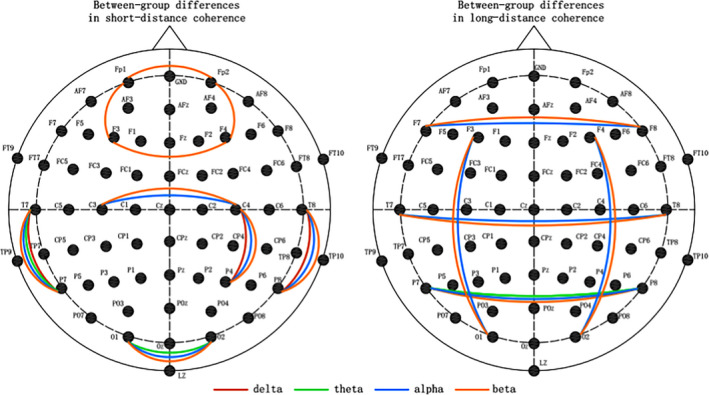
Figure 2.

Coherence showing between‐group significant differences in short‐distance and long‐distance connectivity (p < .05). The red color lines denotes that ASD group have significantly increased coherence in delta band; the green color lines denotes the significantly increased coherence in ASD group in theta band; the blue color lines denotes the significantly increased coherence in ASD group in alpha band; the orange color lines denotes the significantly increased coherence in ASD group in beta band
