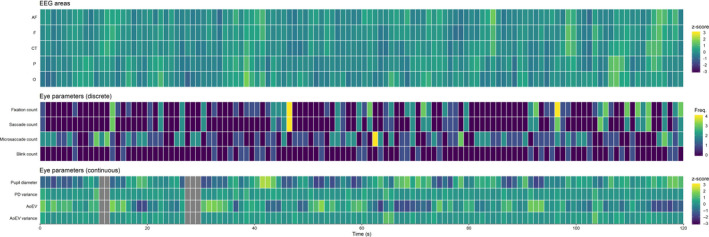
Figure 1.

Exemplary segmented data of the 120 s resting state period of one participant, which forms the basis of the electroencephalography (EEG)—eye‐tracking covariation analysis. All EEG and eye‐tracking parameters were segmented to 1‐s segments represented by single tiles. Continuous parameters (EEG alpha, and PD, PD variance, AoEV, and AoEV variance) were z‐scaled; for discrete parameters, the frequency of occurrence within the time segment was counted. AF, anteriofrontal; AoEV, Angle of Eye Vergence; CT, centro‐temporal; F = frontal; O, occipital; P, parietal; PD, pupil diameter. Gray tiles mark missing data
