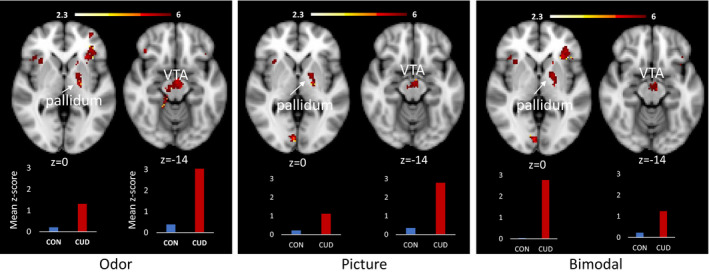
Figure 6.

Significant between‐group differences in fMRI activation to unimodal and bimodal cannabis cues compared to baseline. The clusters depicted reflect significant activation based on Whole‐brain correction (insular cortex, VTA [odor only], and occipital cortex) and region of interest analyses (VTA [picture and bimodal], and pallidum). Bar graphs show the mean z‐values for all voxels within the significant pallidum (left) and VTA (right) cluster for the CON group (blue) and the CUD group (red). Images are presented in radiological convention (R = L). Coordinates are MNI space. The color bar represents z values for the fMRI activation clusters
