
Figure 8.
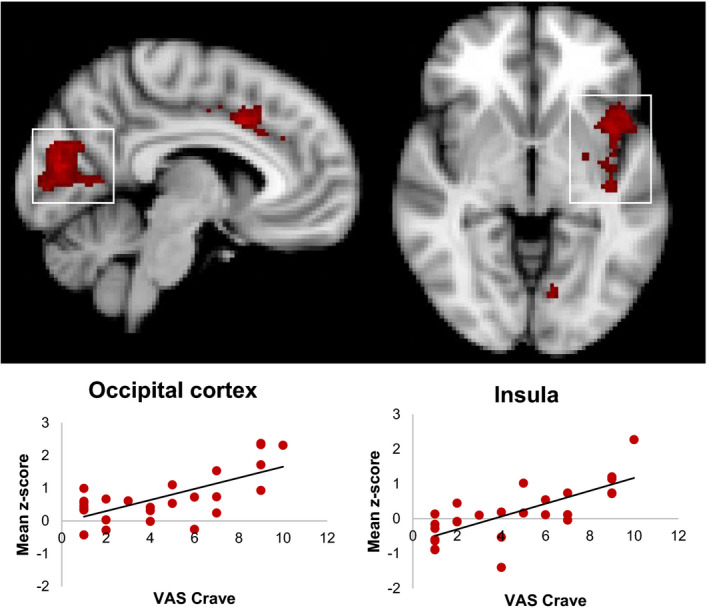
Relationship between fMRI activation to bimodal cannabis cues and self‐reported craving in the CUD group. Clusters signify brain regions showing a significant (p < .05, corrected) correlation. Scatter plots depicting the relationship between craving and activation (labeled using a white box) are provided for descriptive purposes only. For each participant, a mean z‐score was obtained by averaging the z‐score of all the voxels within the mask defined by the significant group cluster and plotted against their VAS craving score