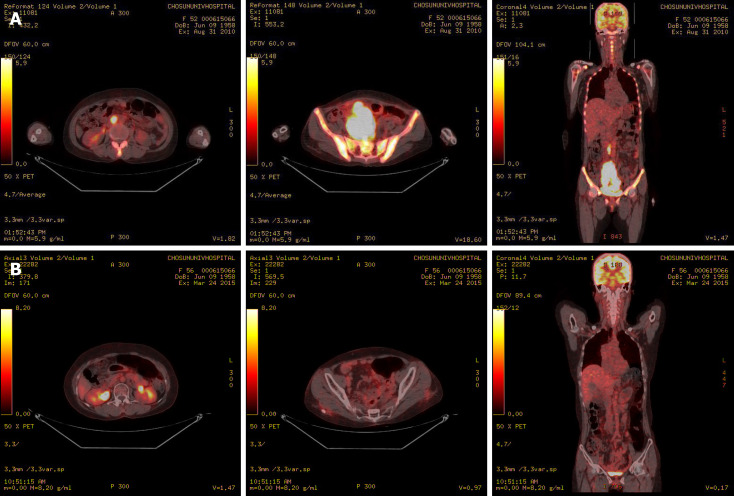
Figure 3.
Positron emission tomography–computed tomography. A: Positron emission tomography–computed tomography revealing hypermetabolism of the huge mass in the pelvic cavity, multiple peritoneal nodules, and para-aortic lymph nodes; B: Hypermetabolism of the huge mass in the pelvic cavity, multiple peritoneal nodules, and para-aortic lymph nodes showing improvement after chemotherapy.

