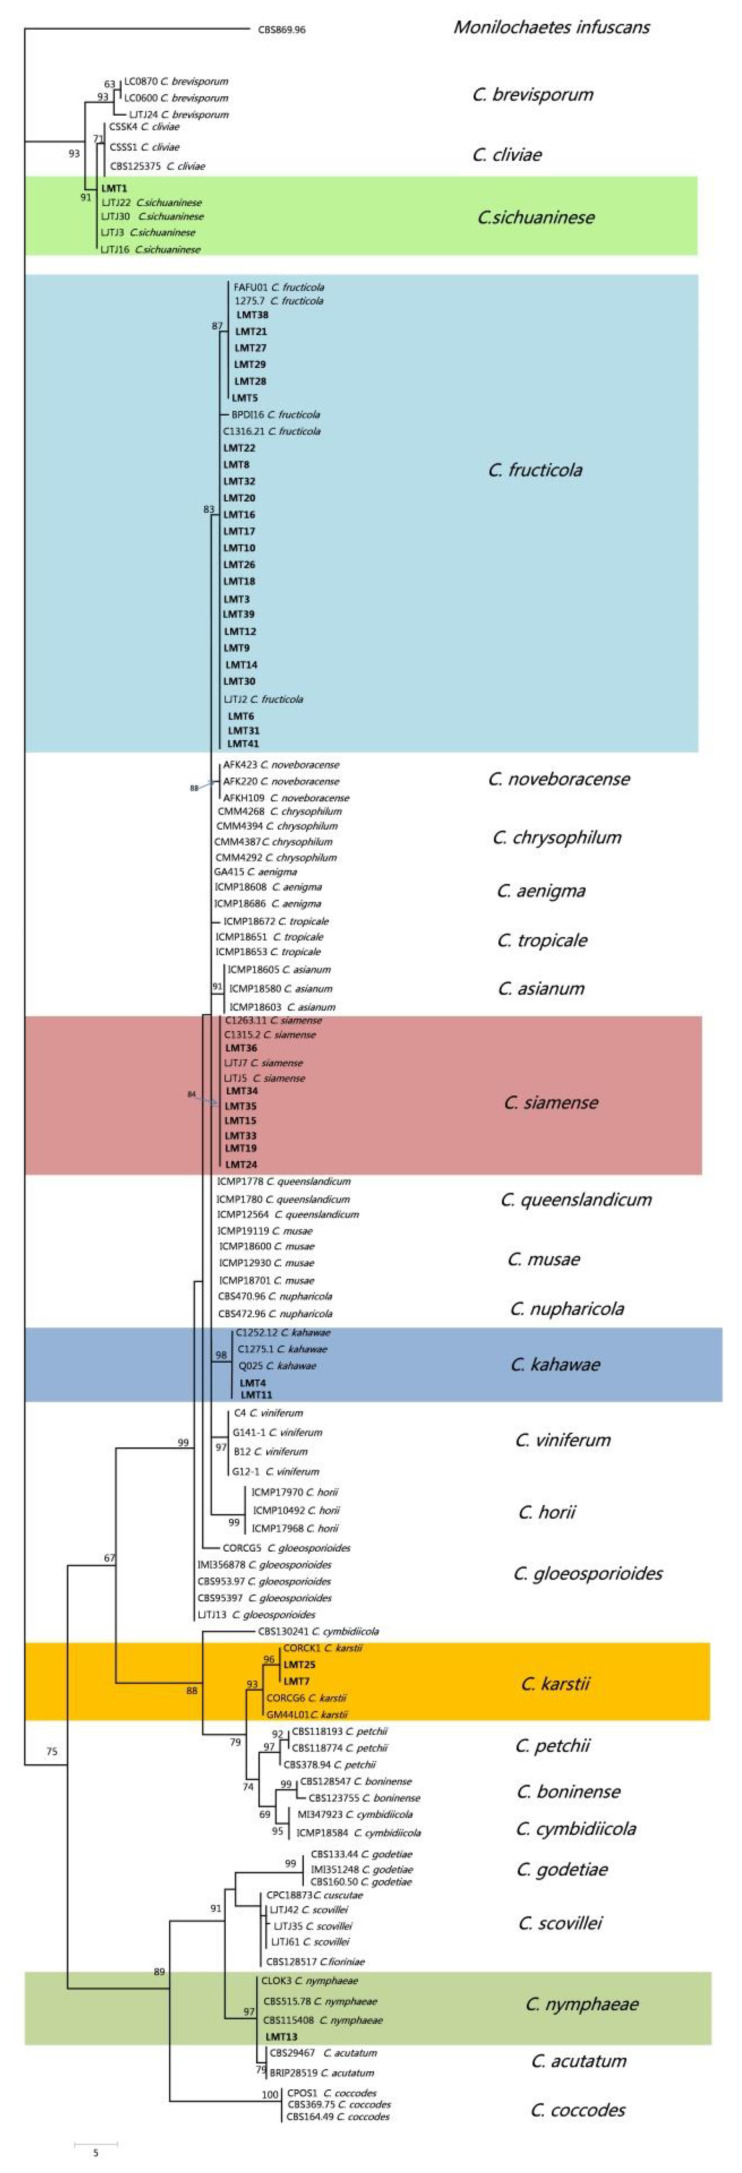
Figure 3.
Phylogenetic tree generated from maximum parsimony analysis based on GAPDH, ITS, TUB2, ACT and CAL gene sequences. Parsimony bootstrap values of more than 50% are shown at the nodes. Isolates from this study are shown in bold. The tree is rooted with Monilochaetes infuscans. Detailed information is provided in Table S1.

