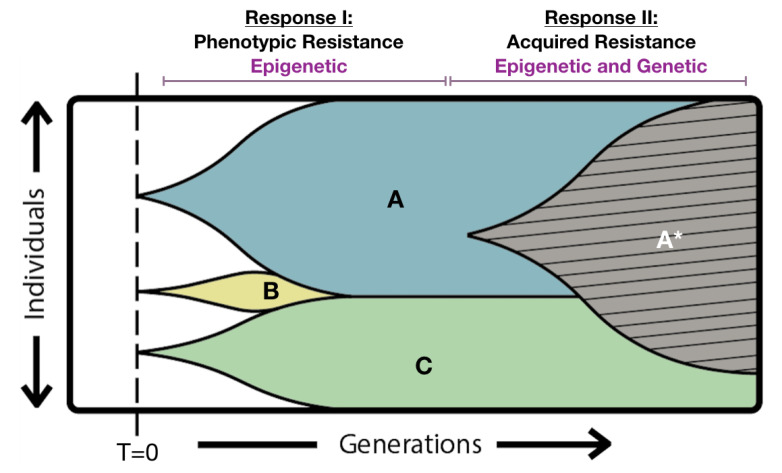
Figure 2.
Theoretical epigenetic and genetic combination model to explain Candida spp. growth in the presence of high concentrations of anti-fungal drug. The diagram shows the epigenotype and genotype of an evolving population of Candida yeast cells when exposed to an antifungal drug (concentration > MIC) at time 0 (T = 0). Three individual cells are capable of growing under these conditions and their descendants give rise to sub-populations A, B, and C. We postulate that this ability to grow is dictated by an advantageous epigenetic program within each of these cells either at the time of antifungal exposure, or very soon thereafter. We refer to this as response I, which accounts for the trailing growth phenotype typically seen 48 h after drug exposure. In this particular example, sub-population B is outcompeted by sub-populations A and C which presumably have greater relative adaptive fitness. After some time, a cell in sub-population A acquires a genetic lesion that confers anti-fungal resistance (A*), providing a selective advantage over its non-mutated ancestors, and the population as a whole has entered phase II, the acquired resistance phase. In the time period depicted, a fraction of descendants from the epigenetically defined, phenotypically resistant population C remain.

