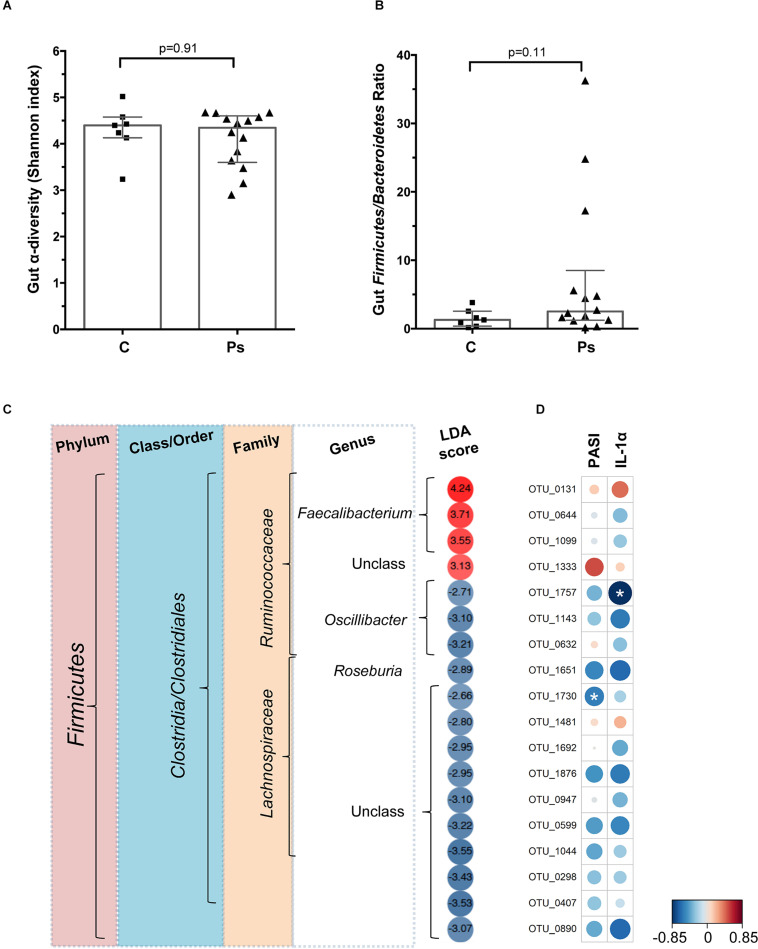
FIGURE 3.
(A) Microbial species α-diversity measured by Shannon index in the gut of the psoriasis individuals and controls. (B) Gut Firmicutes/Bacteroides ratio of psoriasis + individuals and controls. (C) Heatmap showing the LefSe-derived LDA scores for each of the OTU (n = 18) differentially abundant in the gut of psoriasis + participants. Data based on N = 21 samples. (D) Heatmap based on the Pearson coefficients of correlation between the psoriasis-associated microbial taxa, baseline IL-1α and PASI scores. Analysis based on N = 14 samples. Significant correlations marked by asterisks (*).

