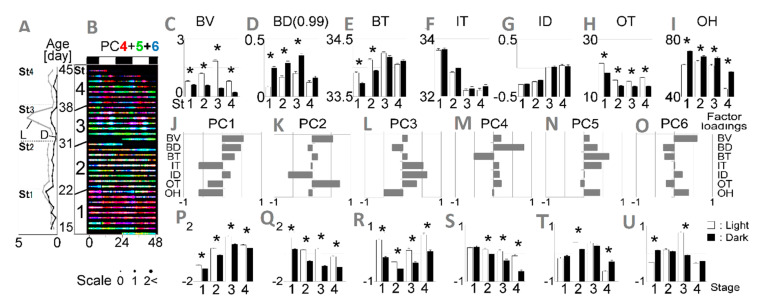
Figure 2.
Developmental shift of circadian rhythm in three biological (B-) and four environmental (I-, O-) indices averaged in four infants and in terms of principal component scores. (A) Biological locomotion velocity (BV) trend lines compared between light (L) and dark (D) phases from age stage St1 to St4; (B) 30-min-raster plots (48 h horizontally versus postnatal day vertically) with a size marker at the bottom; overlaid raster plot of principal components PC4 (red), PC5 (green) and PC6 (blue). In C-I; Light-dark statistical comparison per age stage for each variable. Error bars indicate standard error of the mean (s.e.m.) * p < 0.05 by Tukey’s honestly significant difference (HSD) test following two-way analysis of variance (ANOVA); (C) biological locomotion velocity (BV); (D) place preference toward the door (BD) more than 99% (BD (0.99)); (E) body surface temperature (BT); (F) indoor temperature (IT); (G) indoor temperature gradient toward door (ID); (H) outdoor temperature (OT); (I) outdoor humidity (OH); (J–O) seven factor loadings of PC1–PC6. In (P–U) light-dark statistical comparison per age stage for PC1–PC6. Error bars indicate s.e.m. * p < 0.05 by Tukey’s HSD test following two-way ANOVA.

