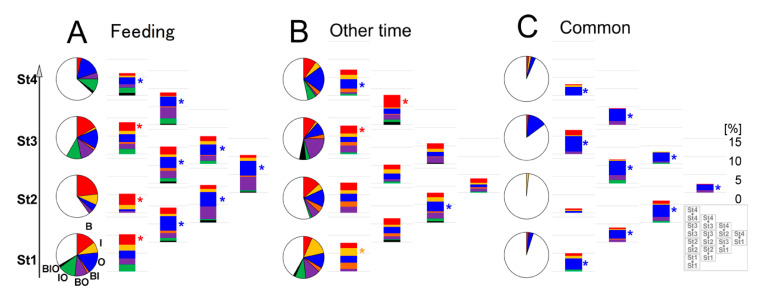
Figure 7.
Correlated B-, I-, and O- variable ratios per intra- or inter-stage analysis by LMMs between two time points of feeding / other, day and night. In each specific condition of feeding (A), other day time (B), or common to both (C), pie charts represent the ratio of selected regression-model types, categorized as a single or combined contribution of significant B-, I-, O- variables based on LMMs followed by cAIC in “intra-stage” analysis in each age stage. The right bottom box represents each analyzed stage combination layout of the accumulated bars.

