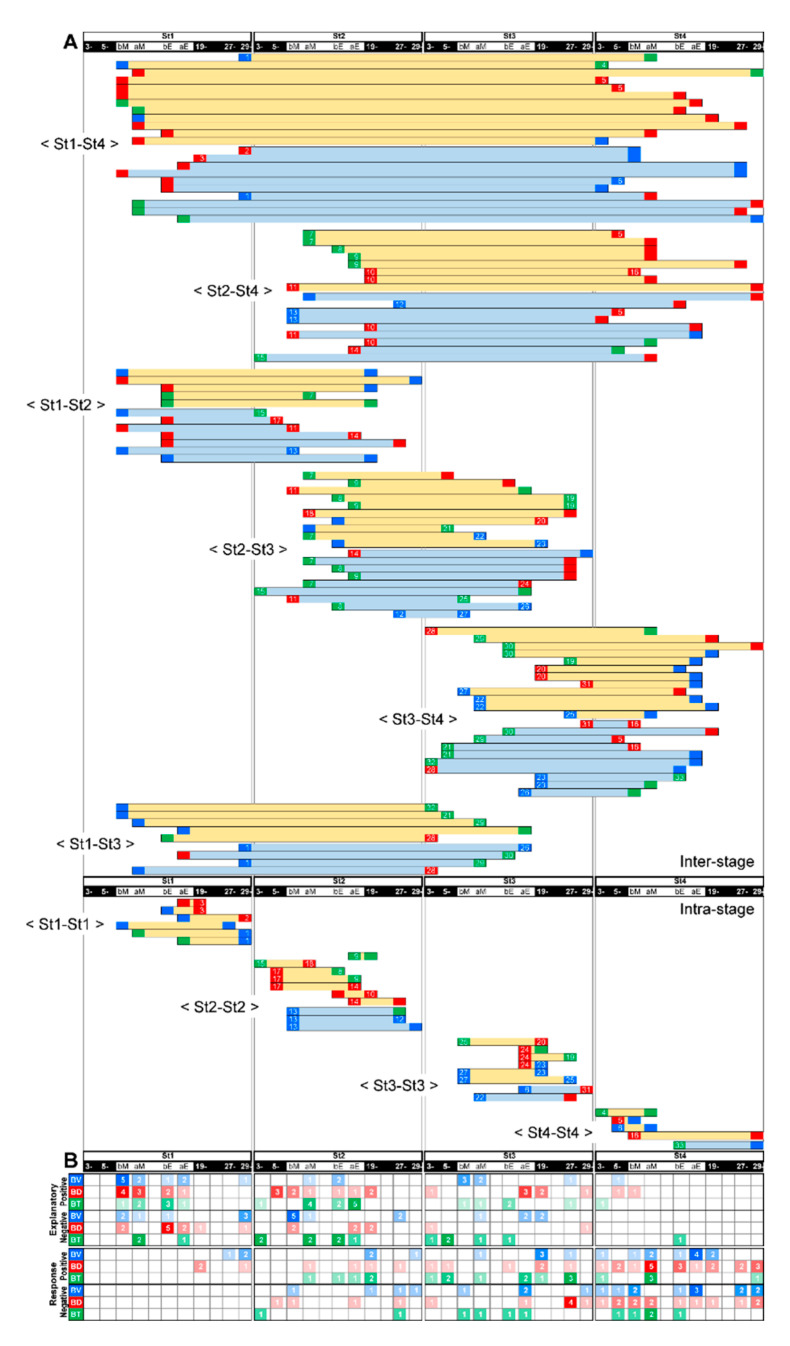
Figure 8.
Feeding-dependent pathways of B-variables by LMMs. Age-stage and focal time are arranged horizontally in the time series. (A). Light yellow and light blue horizontal bars indicate positive and negative correlation vectors between explanatory (left side of the bars: start) and response (right side of the bars: end) variables, respectively. (B). The heat maps represent the summed number (color gradation) of positive or negative BV (V, blue), BD (D, red) and BT (T, green) as explanatory (upper) or response (lower) variables per focal time in each age-stage.

