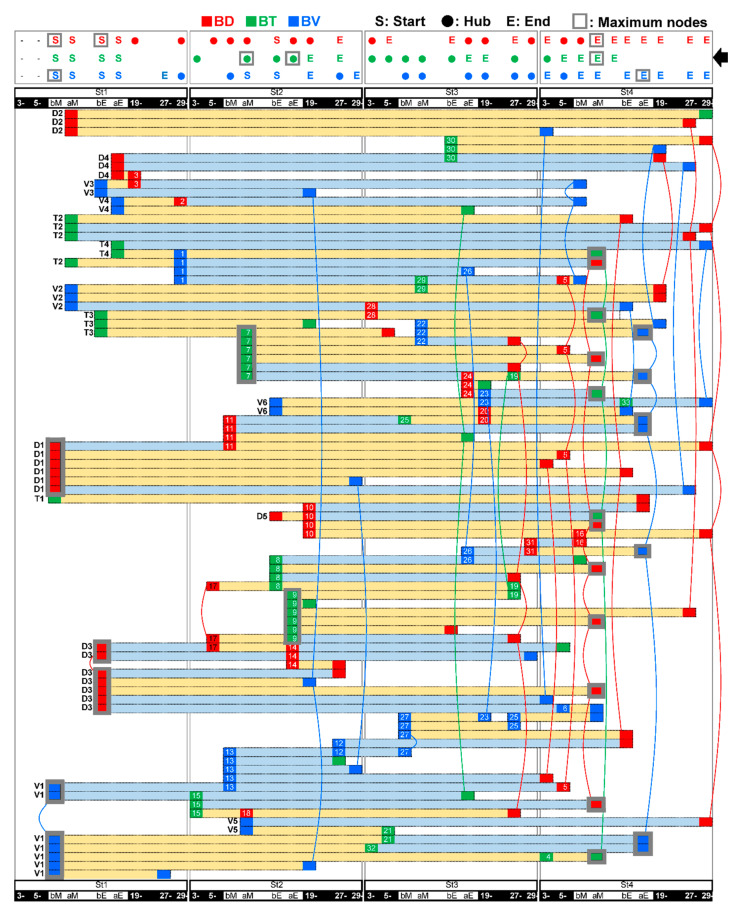
Figure 9.
Connections of the feeding-dependent pathways depicted in Figure 8. The horizontal bars are the same as in Figure 8 re-arranged. The top table shows any presence of significant start (explanatory, “S”), hub-like relays (both explanatory and response, filled circle), or end (response, “E”) variables. Gray squares indicate the maximum response node (MRN) or maximum explanatory node (MEN) in each variable (see also Figure 10 and Figure 11). Same variables separately arranged are connected with one another with colored curves. The start points at St1 or St2 are marked by V1–V6, D1–D5 and T1–T4.

