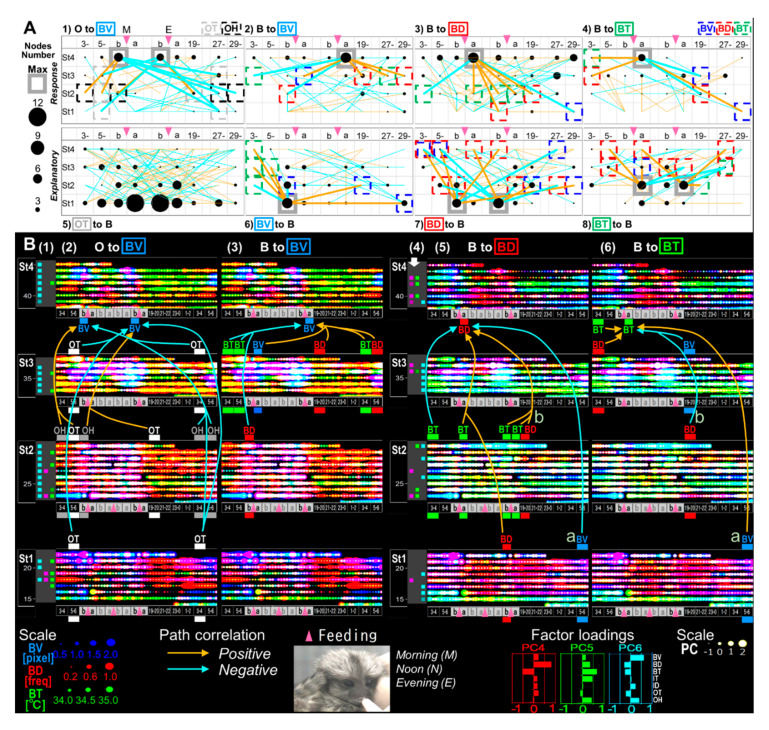
Figure 10.
Feeding-dependent positive/negative pathways determined by LMMs on gradient or unique circadian development, on the basis of B(biological)-indices. (A) The numbers of explanatory or response variables (“nodes”) in each time point (horizontal axis; 3–4 (3-) and 5–6 (5-) a.m., before (b) and after (a) morning (M) and evening (E) feeding (pink arrow-head), 19–20 (19-) p.m., 27–28 (27-), 29–30 (29-) a.m.) are shown as circles, which estimate the effects of the variables. The effects as responses and explanatory variables are estimated by the regression of BV, BD or BT on arbitrary O- (1) or B- indices (2–4) and the regression of arbitrary B- indices on OT (5), BV, BD or BT (6–8; see also Figure 11). The maximum response nodes (MRNs) and maximum explanatory nodes (MENs) are marked by gray squares. (B) Overlaid 30-min-raster plot of BV (blue), BD (red) and BT (green; left side, 2–3) or PC4 (red), PC5 (green) and PC6 (blue; right side, 5–6), are displayed separately for each age stage. Significant light-dark differences in each day are shown as their own-colored squares on the left side (1), (4) of the raster plots (p < 0.05 (lighter colors) and p < 0.1 (darker colors) by Tukey’s HSD test following two-way ANOVA). The BV MRNs pathways regressed on O- indices (B2), “O to BV” (A1)), BV regressed on B- indices (B3), “B to BV” (A2)), BD regressed on B- indices (B5), “B to BD” (A3)), and BT regressed on B- indices (B6), “B to BT” (A4)) extracted by LMMs followed by cAIC are also depicted.

