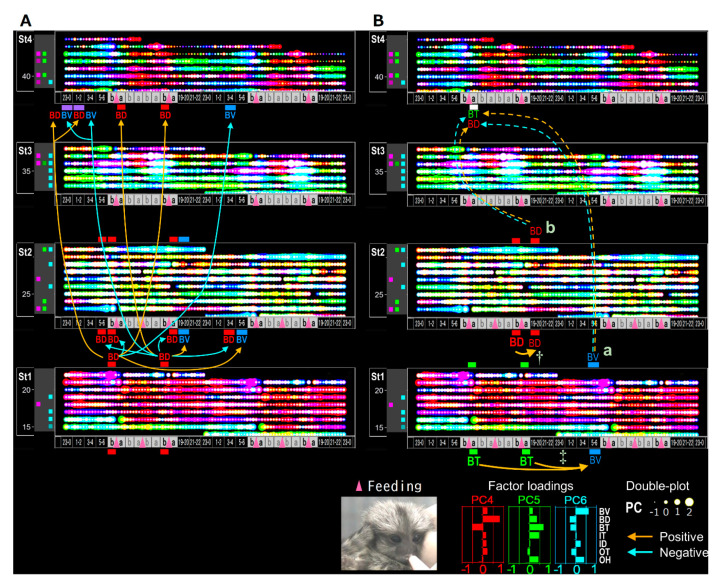
Figure 13.
The origin of candidate trigger pathways revealed in Figure 10. The double plots are same as shown in Figure 10B, overlay of PC4–PC6. (A) The pathways from the maximum explanatory nodes revealed in the regression of arbitrary B-indices on BD. (B) Solid lines marked by a dagger and double dagger indicate the original pathways of key pathways marked by “a” and “b” corresponding to “a” and “b” in Figure 10(B5,B6).

