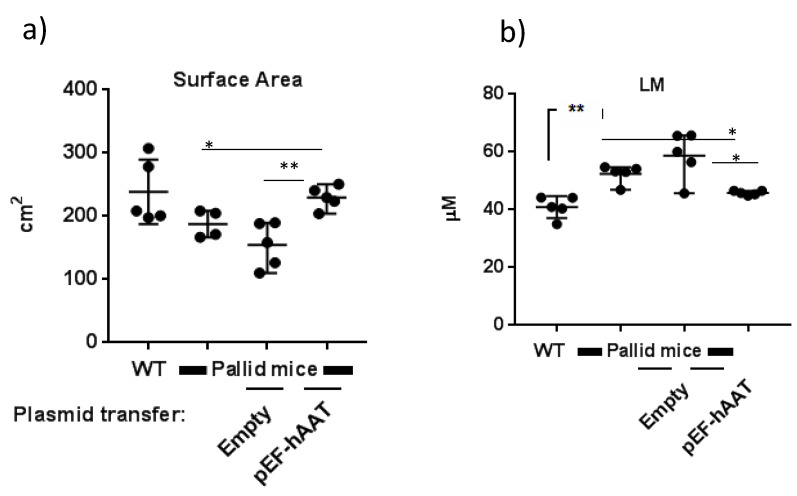
Figure 4.
Lung morphometry: (a) septal surface area and (b) mean linear intercept (LM) in different experimental groups, as indicated. For each animal, the left lobe was analysed, and all parameters relate to this specific lobe. Statistical values are expressed as mean ± SD, unpaired t test was performed, and each group was compared to each other. * p < 0.05, ** p < 0.01.

