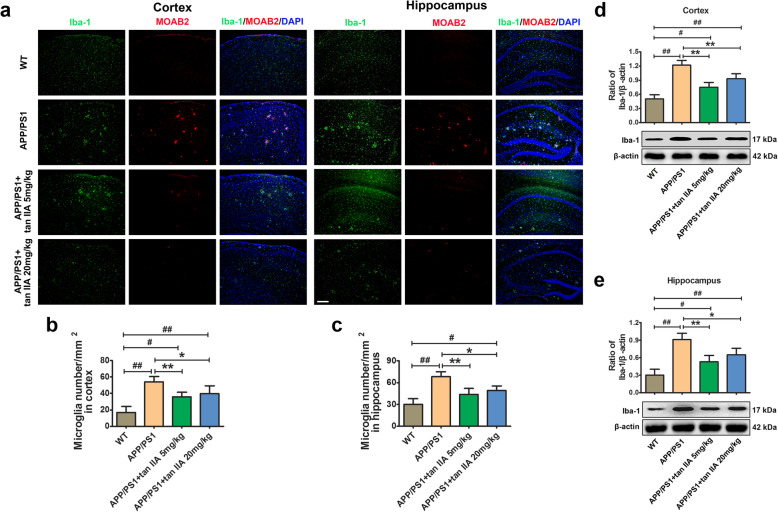
Fig. 4.
Tan IIA suppresses microglial activation in APP/PS1 mice. a Colocalization of fluorescent of Iba-1 (green), MOAB2-positive Aβ (red), and DAPI (blue) in the parietal cortex and hippocampus. Scale bar = 200 μm. b Quantitative analysis of microglia number in the parietal cortex. c Quantitative analysis of microglia number in the hippocampus. d Western blotting and densitometry analysis of Iba-1 in the parietal cortex. e Western blotting and densitometry analysis of Iba-1 in the hippocampus. n = 5. Data were presented as mean ± SD. #p < 0.05 or ##p < 0.01 vs. WT group, and *p < 0.05 or **p < 0.01 vs. APP/PS1 group

