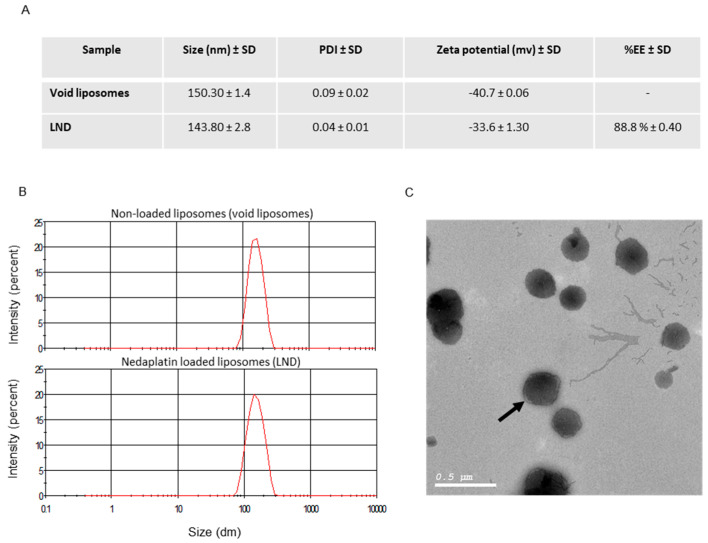
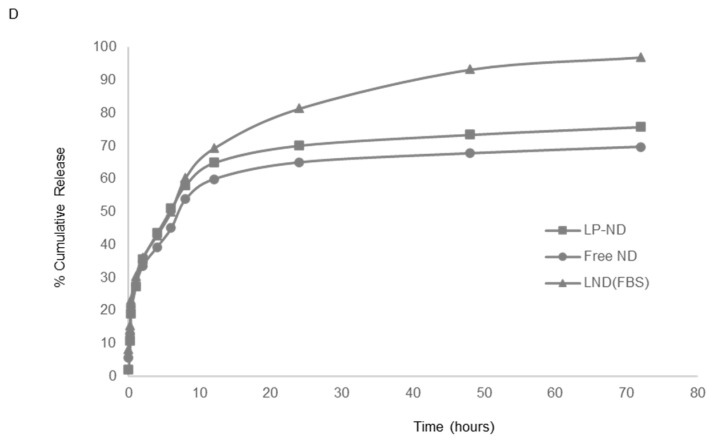
Figure 1.
Liposome preparation and characterization. (A) Liposome characterization. (B) Size distribution plots as obtained at a scan rate of 140 counts per second at 25 °C. Top panel is for nonloaded liposomes while the bottom panel is for nedaplatin-loaded liposomes. (C) TEM image for LND formulation showing uniform spherical structures. The coating PEG layers are also shown as lighter outer circles (see arrow). (D) Nedaplatin and formulated nedaplatin release profiles in PBS and FBS media. Circles represent free nedaplatin in PBS, squares are liposomal nedaplatin in PBS and triangles represent liposomal nedaplatin in FBS.


