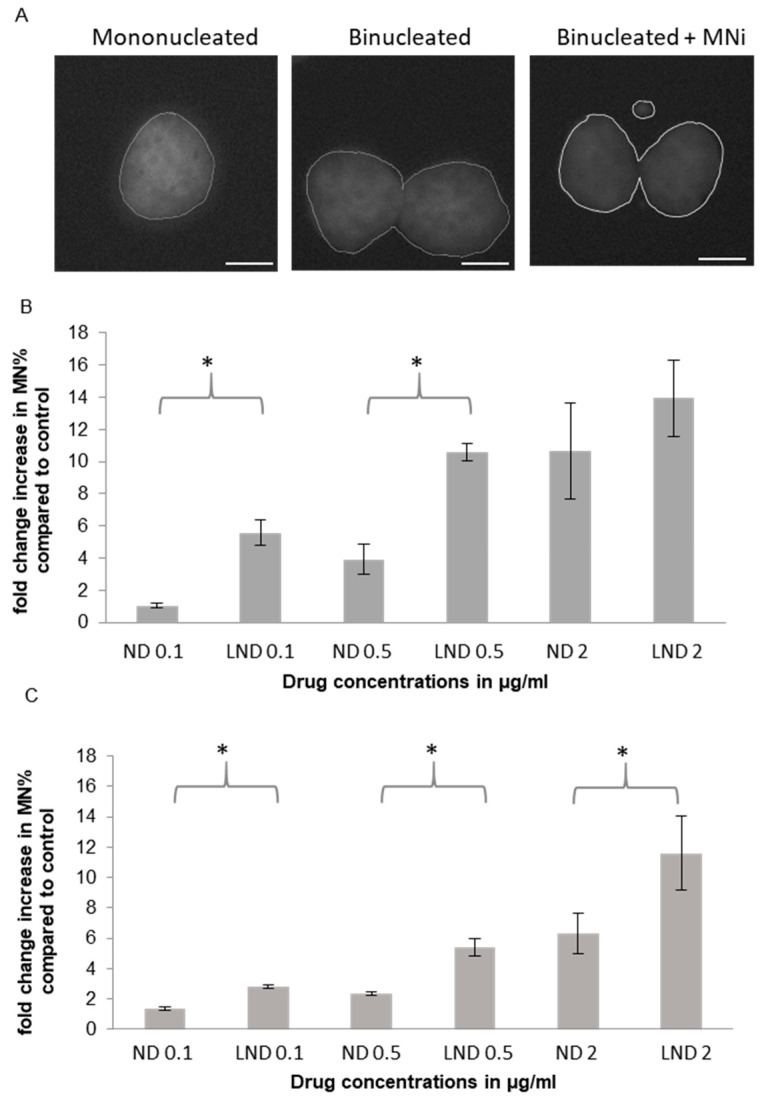
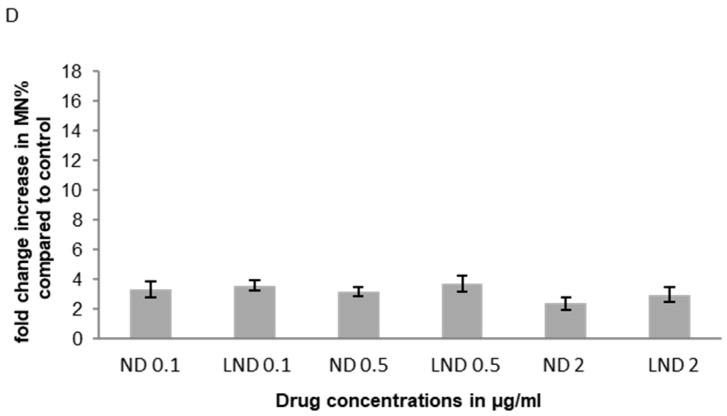
Figure 4.
Genotoxicity of free and liposomal ND in different cell lines assessed through micronucleus formation induction. (A) Representative image of MNi. (B) A549; (C) U2OS and (D) WI-38 shows a significant increase in MNi induction between free and liposomal ND in cancer cell lines A and B, but not in normal cell lines, D. Multiple pair-wise t-tests show the concentrations at which a significant difference between both drugs was observed. These points are indicated by asterisks * (p < 0.05). Scale bars are 5 µm.


