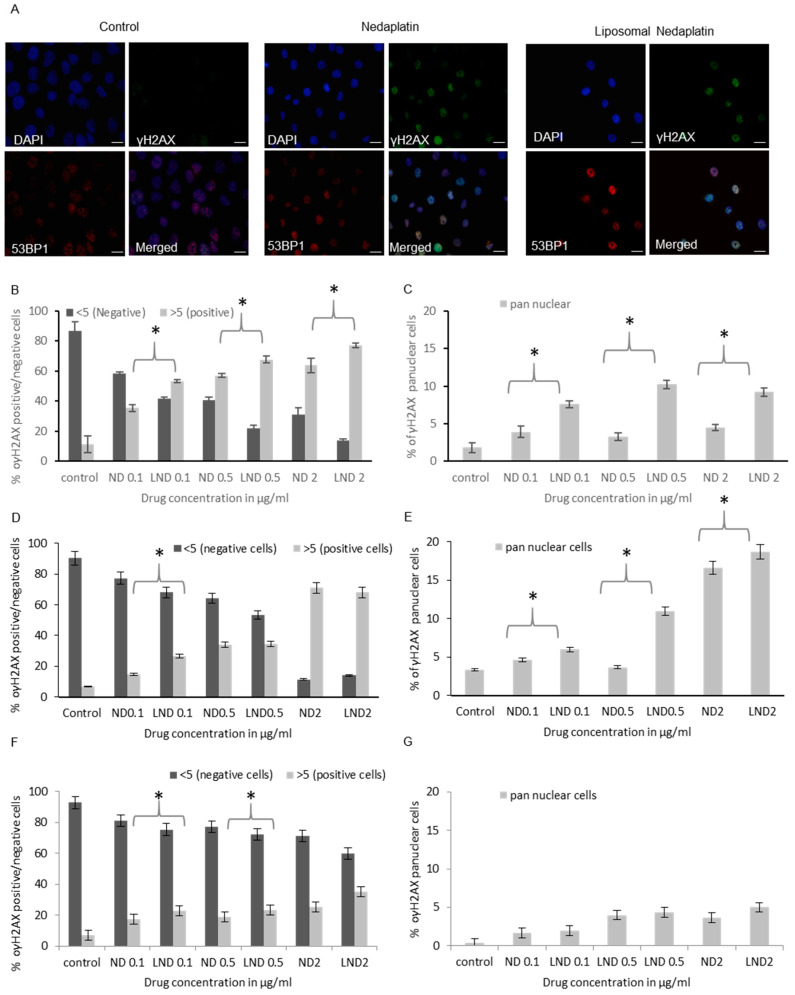
Figure 5.
Genotoxicity of free and liposomal ND in cancer and noncancer cell lines assessed through γH2AX induction. (A) Representative immunofluorescence images of control, ND and LND treated A549 cells. Quantification of γH2AX positive and γH2AX pan nuclear cells, respectively, in (B,C) A549, (D,E) U2OS, (F,G) WI-38 cells. While an overall statistically significant increase in the percentage of cells positive for DNA damage observed with LND compared to ND was shown in all cell lines, a statistically significant increase in the γH2AX pan-nuclear signal was only observed with LND in the cancer cell lines (p-value < 0.05). Multiple pair-wise t-tests showed the concentrations of treatment where a significant difference between LND and ND DNA damage is observed. These points are indicated by asterisks * (p < 0.05) in the charts above. Scale bars are 10 µm.

