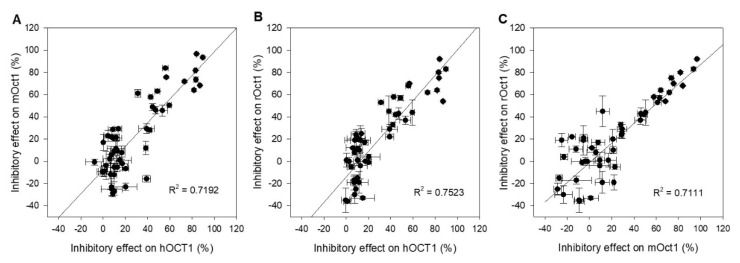
Figure 4.
Scatter plot analysis correlating inhibitory effects of (A) hOCT1 and mOct1, (B) hOCT1 and rOct1, and (C) mOct1 and rOct1. The correlation coefficient R2 value for all three combinations is higher than 0.7, indicating a good correlation between species. Data points represent mean and standard deviation of one individual experiment. Mean values in detail are presented in Table 1 and Table 2.

