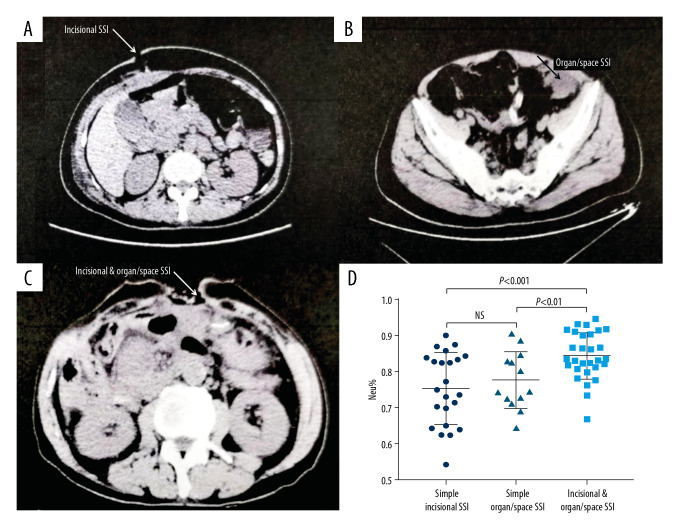
Figure 2.
Representative CT images and serum neutrophils percentage assessment in the 3 groups at the time of SSI diagnosis. (A) CT scanning of simple incisional SSI; (B) CT scanning of simple organ/space incisional SSI; (C) CT scanning of incisional and organ/space SSI; (D) The percentages of serum neutrophils in the 3 groups at the time of SSI diagnosis.

