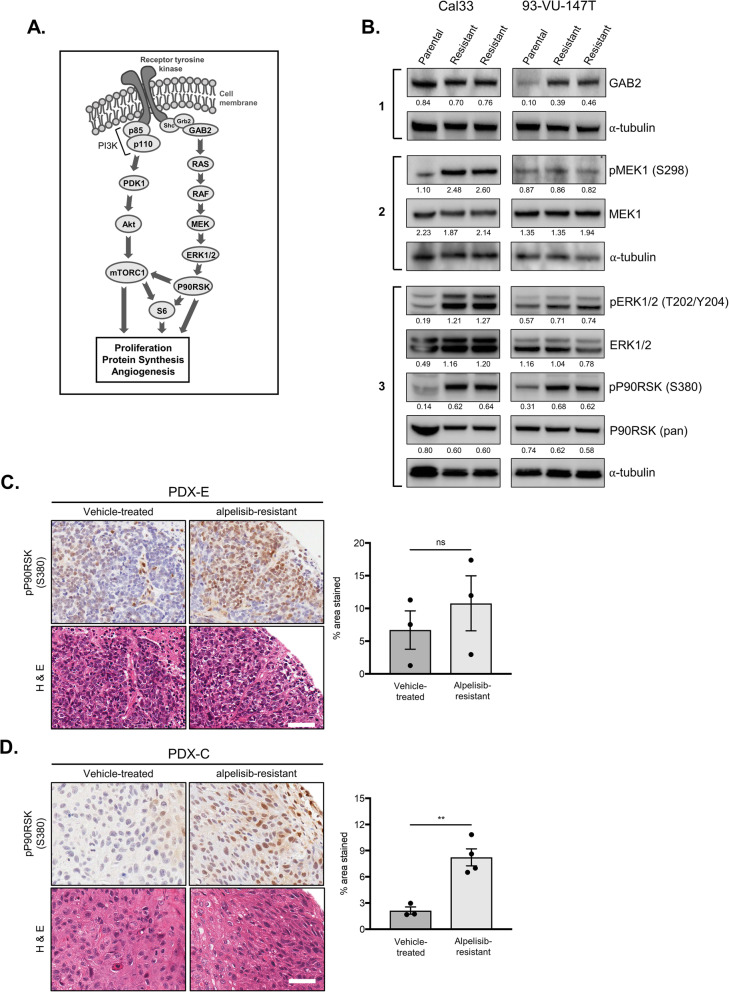
Fig. 6.
Activation of the MAPK signalling pathway in alpelisib-resistant cell lines and PDX models. a Schematic representation of PI3K and MAPK pathways, with crosstalk activating mTORC1 shown. b Immunoblot with indicated parental and alpelisib-resistant lysates examining activation of the MAPK pathway. Densitometric quantification of each protein relative to α-tubulin is shown below each band. c & d Representative IHC sections showing pP90RSK (Ser380) staining in PDX-E c and PDX-C d models. Quantification was completed using Fiji software and is shown below. *** represent p < 0.01, ns = not significant, unpaired Student’s t-test. Scale bars represent 50 μM

