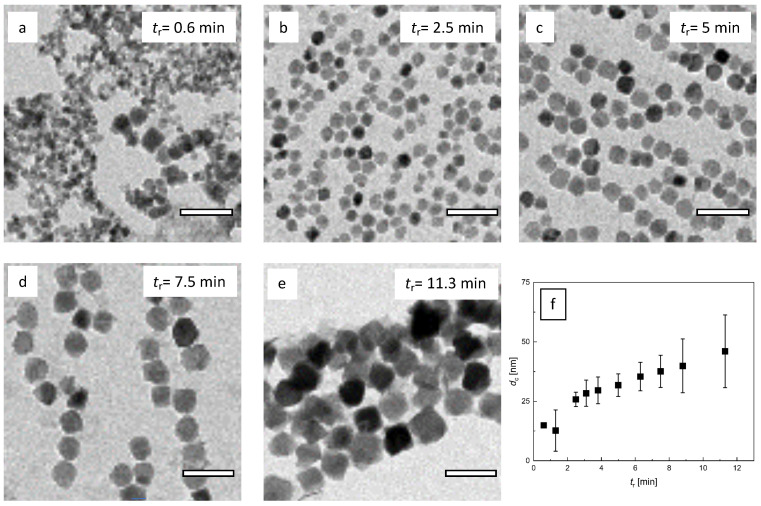
Figure 7.
TEM analysis of micromixer nanoparticle synthesis at Q = 8 mL/min total flow rate and Ts = 52.5 °C. a–e: Variation of residence time tr by adjusting the tubing length. Residence times from 0.6 min (V = 5 mL) to 11.3 min (L = 90 mL). With increasing residence time, particle core size increased. Off optimal process window, size control was limited, and the particle homogeneity decreased (a and e); f: Resulting mean diameter (symbol) and standard deviation (plotted as uncertainty bar) determined by the analysis of N > 5000 individual nanoparticles imaged by TEM as a function of residence time tr. Note, the TEM image analysis of particles synthesized at the lowest residence time tr = 0.6 min did not yield reliable core diameter values.

