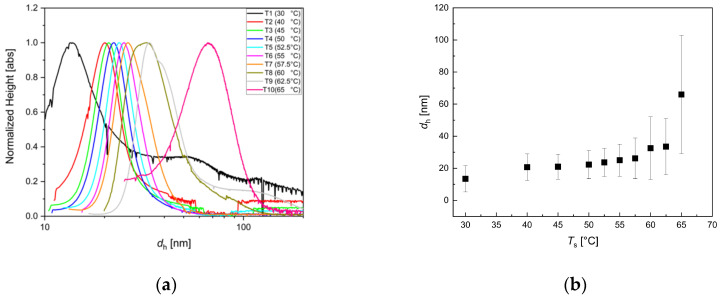
Figure 9.
DCS analysis for iron oxide single-core nanoparticles manufactured by continuous micromixer synthesis at Q = 8 mL/min total flow rate and tr = 3.4 min for different synthesis temperatures Ts = 30, 40, 45, 50, 52.5, 55, 57.5, 60, 62.5 and 65 °C. (a) Hydrodynamic size distribution extracted from DCS measurements; (b) mean hydrodynamic diameter dh (symbols) and FWHM values (depicted as uncertainty bars) as a function of Ts.

